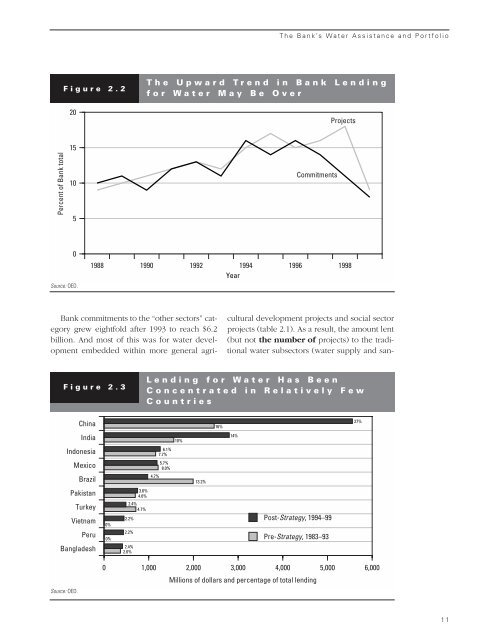
The <strong>Bank</strong>’s Water Assistance and PortfolioFigure 2.220The Upward Trend in <strong>Bank</strong> Lendingfor Water May Be OverProjectsPercent of <strong>Bank</strong> total15105Commitments0Source: OED.1988 1990 1992 1994 1996 1998Year<strong>Bank</strong> commitments to the “other sectors” categorygrew eightfold after 1993 to reach $6.2billion. And most of this was for water developmentembedded within more general agriculturaldevelopment projects and social sectorprojects (table 2.1). As a result, the amount lent(but not the number of projects) to the traditionalwater subsectors (water supply and san-Figure 2.3Lending for Water Has BeenConcentrated in Relatively FewCountriesChina16%27%India10%14%Indonesia6.1%7.7%Mexico5.7%8.0%Brazil4.7%13.2%PakistanTurkeyVietnamPeruBangladesh0%0%3.6%4.6%2.4%4.7%2.2%2.2%2.4%2.0%Post-Strategy, 1994–99Pre-Strategy, 1983–93Source: OED.0 1,000 2,000 3,000 4,000 5,000 6,000Millions of dollars and percentage of total lending11
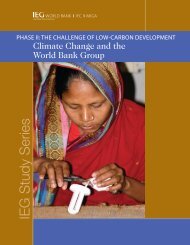
Bridging Troubled Waters: Assessing the <strong>World</strong> <strong>Bank</strong> Water Resources StrategyFigure 2.4Lending to the Traditional WaterSectors Has Declined Since the1993 StrategyOther sectorsIrrigation and drainageWater supplyand sanitationEnvironmentHydropowerFisheriesPost-Strategy, 1994–99Pre-Strategy, 1983–930 1,000 2,000 3,000 4,000 5,000 6,000 7,000Millions of dollars committedSource: OED.itation, irrigation, and drainage) declined. Giventhat most “other sector” water projects are embeddedin operations managed by nonwaterstaff or are not managed at all in demand-led socialfunds, there is growing concern that waterpolicy oversight and coherence is being diluted.That makes it more difficult to apply the principlesof the Strategy.The Poverty Focus of Water Operations IsGetting BetterThe Strategy gives priority to the provision of adequatewater and sanitation services to the poor.OED’s analysis of <strong>Bank</strong> Quality Assurance <strong>Group</strong>(QAG) data found that water projects were notas good as other sector projects in complyingwith the Country Assistance Strategy (CAS)poverty strategy. 5 Despite this, more water investmentgoes to poorer countries than <strong>Bank</strong> investmentas a whole, primarily because irrigationand drainage investments have become moresharply focused on the poorest countries. Indeed,the poverty focus of irrigation and drainageprojects rose by 23 percent after the Strategy.Conversely, formal water supply and sanitationoperations declined by 13 percent—primarily becauseof the increased focus on lending to financiallyviable urban utilities that outweighs thenew generation of pro-poor rural Water Supplyand Sanitation (WSS) projects. Indirect lendingT able 2.1W ater Supply and Sanitation Investmentsin Nontraditional Sectors Are IncreasingInvestment ($millions) a 1988–93 1994–99 Projects (number) 1988–93 1994–99Official WSS 5,556 3,984 Official WSS 64 67Other sectors 56 1,181 Other sectors 8 53Total 5,612 5,165 Total 72 120a. Constant 1996 US $.Source: OED data.12