APRILFeedback
Feedback April 2003 (Vol. 44, No. 2) - Broadcast Education ...
Feedback April 2003 (Vol. 44, No. 2) - Broadcast Education ...
- No tags were found...
Create successful ePaper yourself
Turn your PDF publications into a flip-book with our unique Google optimized e-Paper software.
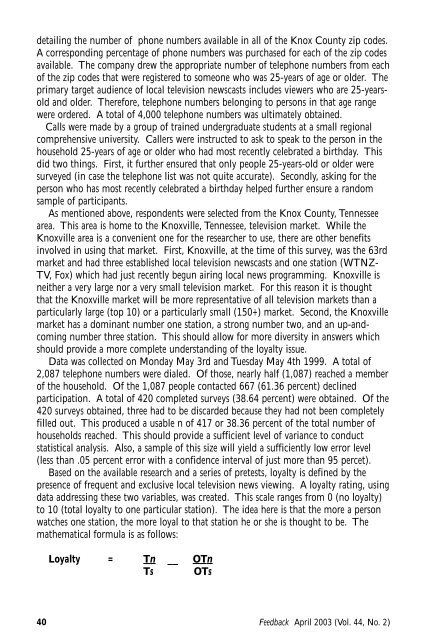
detailing the number of phone numbers available in all of the Knox County zip codes.A corresponding percentage of phone numbers was purchased for each of the zip codesavailable. The company drew the appropriate number of telephone numbers from eachof the zip codes that were registered to someone who was 25-years of age or older. Theprimary target audience of local television newscasts includes viewers who are 25-yearsoldand older. Therefore, telephone numbers belonging to persons in that age rangewere ordered. A total of 4,000 telephone numbers was ultimately obtained.Calls were made by a group of trained undergraduate students at a small regionalcomprehensive university. Callers were instructed to ask to speak to the person in thehousehold 25-years of age or older who had most recently celebrated a birthday. Thisdid two things. First, it further ensured that only people 25-years-old or older weresurveyed (in case the telephone list was not quite accurate). Secondly, asking for theperson who has most recently celebrated a birthday helped further ensure a randomsample of participants.As mentioned above, respondents were selected from the Knox County, Tennesseearea. This area is home to the Knoxville, Tennessee, television market. While theKnoxville area is a convenient one for the researcher to use, there are other benefitsinvolved in using that market. First, Knoxville, at the time of this survey, was the 63rdmarket and had three established local television newscasts and one station (WTNZ-TV, Fox) which had just recently begun airing local news programming. Knoxville isneither a very large nor a very small television market. For this reason it is thoughtthat the Knoxville market will be more representative of all television markets than aparticularly large (top 10) or a particularly small (150+) market. Second, the Knoxvillemarket has a dominant number one station, a strong number two, and an up-andcomingnumber three station. This should allow for more diversity in answers whichshould provide a more complete understanding of the loyalty issue.Data was collected on Monday May 3rd and Tuesday May 4th 1999. A total of2,087 telephone numbers were dialed. Of those, nearly half (1,087) reached a memberof the household. Of the 1,087 people contacted 667 (61.36 percent) declinedparticipation. A total of 420 completed surveys (38.64 percent) were obtained. Of the420 surveys obtained, three had to be discarded because they had not been completelyfilled out. This produced a usable n of 417 or 38.36 percent of the total number ofhouseholds reached. This should provide a sufficient level of variance to conductstatistical analysis. Also, a sample of this size will yield a sufficiently low error level(less than .05 percent error with a confidence interval of just more than 95 percet).Based on the available research and a series of pretests, loyalty is defined by thepresence of frequent and exclusive local television news viewing. A loyalty rating, usingdata addressing these two variables, was created. This scale ranges from 0 (no loyalty)to 10 (total loyalty to one particular station). The idea here is that the more a personwatches one station, the more loyal to that station he or she is thought to be. Themathematical formula is as follows:Loyalty = Tn __ OTnTs OTs40Feedback April 2003 (Vol. 44, No. 2)


