APRILFeedback
Feedback April 2003 (Vol. 44, No. 2) - Broadcast Education ...
Feedback April 2003 (Vol. 44, No. 2) - Broadcast Education ...
- No tags were found...

Create successful ePaper yourself
Turn your PDF publications into a flip-book with our unique Google optimized e-Paper software.
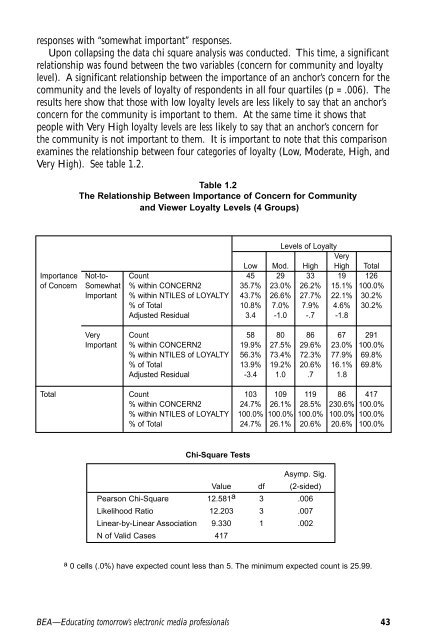
esponses with “somewhat important” responses.Upon collapsing the data chi square analysis was conducted. This time, a significantrelationship was found between the two variables (concern for community and loyaltylevel). A significant relationship between the importance of an anchor’s concern for thecommunity and the levels of loyalty of respondents in all four quartiles (p = .006). Theresults here show that those with low loyalty levels are less likely to say that an anchor’sconcern for the community is important to them. At the same time it shows thatpeople with Very High loyalty levels are less likely to say that an anchor’s concern forthe community is not important to them. It is important to note that this comparisonexamines the relationship between four categories of loyalty (Low, Moderate, High, andVery High). See table 1.2.Table 1.2The Relationship Between Importance of Concern for Communityand Viewer Loyalty Levels (4 Groups)Levels of LoyaltyVeryLow Mod. High High TotalImportance Not-to- Count 45 29 33 19 126of Concern Somewhat % within CONCERN2 35.7% 23.0% 26.2% 15.1% 100.0%Important % within NTILES of LOYALTY 43.7% 26.6% 27.7% 22.1% 30.2%% of Total 10.8% 7.0% 7.9% 4.6% 30.2%Adjusted Residual 3.4 -1.0 -.7 -1.8Very Count 58 80 86 67 291Important % within CONCERN2 19.9% 27.5% 29.6% 23.0% 100.0%% within NTILES of LOYALTY 56.3% 73.4% 72.3% 77.9% 69.8%% of Total 13.9% 19.2% 20.6% 16.1% 69.8%Adjusted Residual -3.4 1.0 .7 1.8Total Count 103 109 119 86 417% within CONCERN2 24.7% 26.1% 28.5% 230.6% 100.0%% within NTILES of LOYALTY 100.0% 100.0% 100.0% 100.0% 100.0%% of Total 24.7% 26.1% 20.6% 20.6% 100.0%Chi-Square TestsAsymp. Sig.Value df (2-sided)Pearson Chi-Square 12.581 a 3 .006Likelihood Ratio 12.203 3 .007Linear-by-Linear Association 9.330 1 .002N of Valid Cases 417a 0 cells (.0%) have expected count less than 5. The minimum expected count is 25.99.BEA—Educating tomorrow’s electronic media professionals 43