anked 26 to 50. After eliminating national and international stories, as well as sportsand weather blocks, the researchers were able to identify 112 sources to be surveyedabout the accuracy of the story involving them.Five surveys came back for insufficient or incorrect address and were not forwardable.Of the remaining 107 packets, 61 sources did complete and return the surveys. Thirtynineof them (64.5 percent) said the story was entirely correct, 19 of them or 30.6percent generally correct (implying one or more errors), and only three (4.9 percent)said the stories were largely incorrect.Roughly two-thirds of the noted errors were “objective” in that they weredemonstrably untrue. The remaining third were more of the “subjective” variety,complaints about misleading emphasis or inadequate clarity. The relatively highaccuracy scores may be a function of a phenomenon noted in reporter-source relationsstudies. Cameron, Sallot, and Curtin (1997) summarized dozens of such studies. Theyobserved that many sources are wary of the overall skills of reporters. However, asatisfying news experience with one reporter, while it may not cause a source to rethinkhis or her overall opinion of news or media or journalists, probably will cause thatsource to make a mental exception for that reporter or that story.METHODThis work used TV station web sites as a new tool for investigating accuracy in localTV news. The researchers identified and selected eleven station web sites. These sites atthe time offered at least a week’s worth of full-text newscast scripts. The stations alsorepresent large, medium and small markets, and affiliations with all of the leading fourtelevision networks.The stations used were: WTVF, Nashville, Tennessee; WDBJ, Roanoke, Virginia;KHON, Honolulu, Hawaii; KMEG, Sioux City, Iowa; WMDT, Salisbury,Maryland; WTVQ, Lexington, Kentucky; KVOA, Tucson, Arizona; WBRZ, BatonRouge, Louisiana; WKBN, Youngstown, Ohio; WDTV, Bridgeport, West Virginia; andWLOS, Asheville, North Carolina.The researchers noted all identifiable sources (paraphrased, quoted, or appearing insound bites) within five weekdays of those news scripts, and then mailed each sourcethe script in which he or she appears, a questionnaire about the accuracy of that script,and a postage-paid reply envelope. The researchers also used Internet search enginesand reference tools to identify home or business addresses of the sources.The questionnaire covered “objective” flaws (demonstrably untrue statements) suchas the wrong time, day, or location given; spelling errors in a person’s name, title, orlocation. The survey provided an opportunity for respondents to comment on more“subjective” errors such as misleading statements, improper emphasis, or a story toocomplicated for the time given. The objective/subjective error distinction was used byBerry, and supported by Ryan (1975) using factor analysis.This project will address the research questions:1.) As reviewed by news sources, how common are [objectively defined] errors in localtelevision newscasts?2.) How often do news sources complain of more subjective errors in localTV newscast content, such as misleading statements, improper emphasis, or insufficienttime or detail?48Feedback April 2003 (Vol. 44, No. 2)
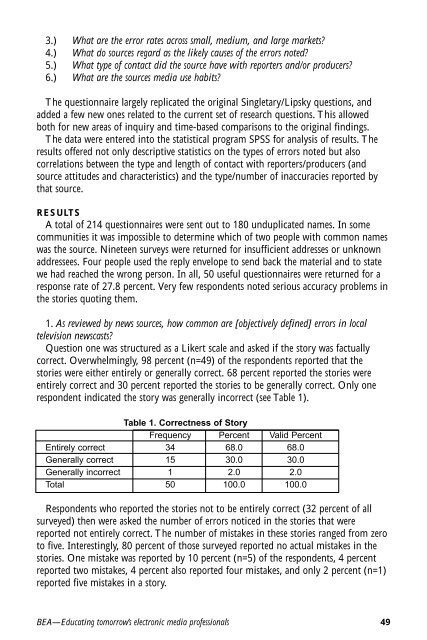
3.) What are the error rates across small, medium, and large markets?4.) What do sources regard as the likely causes of the errors noted?5.) What type of contact did the source have with reporters and/or producers?6.) What are the sources media use habits?The questionnaire largely replicated the original Singletary/Lipsky questions, andadded a few new ones related to the current set of research questions. This allowedboth for new areas of inquiry and time-based comparisons to the original findings.The data were entered into the statistical program SPSS for analysis of results. Theresults offered not only descriptive statistics on the types of errors noted but alsocorrelations between the type and length of contact with reporters/producers (andsource attitudes and characteristics) and the type/number of inaccuracies reported bythat source.RESULTSA total of 214 questionnaires were sent out to 180 unduplicated names. In somecommunities it was impossible to determine which of two people with common nameswas the source. Nineteen surveys were returned for insufficient addresses or unknownaddressees. Four people used the reply envelope to send back the material and to statewe had reached the wrong person. In all, 50 useful questionnaires were returned for aresponse rate of 27.8 percent. Very few respondents noted serious accuracy problems inthe stories quoting them.1. As reviewed by news sources, how common are [objectively defined] errors in localtelevision newscasts?Question one was structured as a Likert scale and asked if the story was factuallycorrect. Overwhelmingly, 98 percent (n=49) of the respondents reported that thestories were either entirely or generally correct. 68 percent reported the stories wereentirely correct and 30 percent reported the stories to be generally correct. Only onerespondent indicated the story was generally incorrect (see Table 1).Table 1. Correctness of StoryFrequency Percent Valid PercentEntirely correct 34 68.0 68.0Generally correct 15 30.0 30.0Generally incorrect 1 2.0 2.0Total 50 100.0 100.0Respondents who reported the stories not to be entirely correct (32 percent of allsurveyed) then were asked the number of errors noticed in the stories that werereported not entirely correct. The number of mistakes in these stories ranged from zeroto five. Interestingly, 80 percent of those surveyed reported no actual mistakes in thestories. One mistake was reported by 10 percent (n=5) of the respondents, 4 percentreported two mistakes, 4 percent also reported four mistakes, and only 2 percent (n=1)reported five mistakes in a story.BEA—Educating tomorrow’s electronic media professionals 49
- Page 1 and 2: Educating tomorrow’selectronic me
- Page 3 and 4: CONTENTSESSAYTransitionsRalph J. Be
- Page 5 and 6: ESSAYTRANSITIONSBy Ralph J. Begleit
- Page 7 and 8: party. It was a fabulous experience
- Page 9 and 10: een accustomed to leaving my “whe
- Page 11 and 12: ADVISING:THE LITTLE SECRET HIDDEN I
- Page 13 and 14: • Total intake model—all studen
- Page 15 and 16: Response to the survey has never re
- Page 17 and 18: assessment of the Center in conclus
- Page 19 and 20: SENSE-MAKING AND THE PERSONALVIDEO
- Page 21 and 22: database. A limited implementation
- Page 23 and 24: RESEARCHTHE PARTICIPATION OF WOMENI
- Page 25 and 26: Local newsroom employmentIn July 20
- Page 27 and 28: the referral source of each person
- Page 30 and 31: Discussion and ConclusionsOur analy
- Page 32 and 33: Lind, R. A., & Braun, M. J. (1996,
- Page 34 and 35: downloading services. www.schoolsuc
- Page 36 and 37: major professional selling points i
- Page 38 and 39: COURSE GRADINGElement Percent of Du
- Page 40 and 41: REVIEWHyde, Stuart (2003). Idea to
- Page 42 and 43: The primary purpose of this study i
- Page 44 and 45: detailing the number of phone numbe
- Page 46 and 47: these newscasts that “primary”
- Page 48 and 49: As Table 1.3 shows, comparing only
- Page 50 and 51: RESEARCHACCURACY IN LOCAL TELEVISIO
- Page 54 and 55: 2. How often do news sources compla
- Page 56 and 57: Participants were asked which one m
- Page 58 and 59: These stations still archive script
- Page 60 and 61: TABLE 12002 BEA News Division stude
- Page 62 and 63: Eiles at WCHS-TV, Portland, Maine.
- Page 64 and 65: ESSAYWHAT’S OLD IS NEW AGAIN:THE
- Page 66 and 67: are. If the news agency editor or r
- Page 68 and 69: said Sagan, just as broadcast chann
- Page 70 and 71: “We’re perfectly positioned to
- Page 72 and 73: John Miller, News Director of KTVT-
- Page 74 and 75: CLASSROOMGUEST SPEAKERS IN BROADCAS
- Page 76 and 77: students just starting out, their m
- Page 78 and 79: professionals, often with varied jo
- Page 80 and 81: District NewsTo the members of Dist
- Page 82 and 83: several held on college campuses. I
- Page 84 and 85: 2ND PLACE: Jillian Oppegard, Colora
- Page 86 and 87: Faculty News CompetitionC.A. Tuggle
- Page 88 and 89: AWARD OF EXCELLENCE: Kevin Hager, W
- Page 90 and 91: BEA PRESIDENT’S MESSAGEGOALS AND
- Page 92: THANK YOU to the following individu