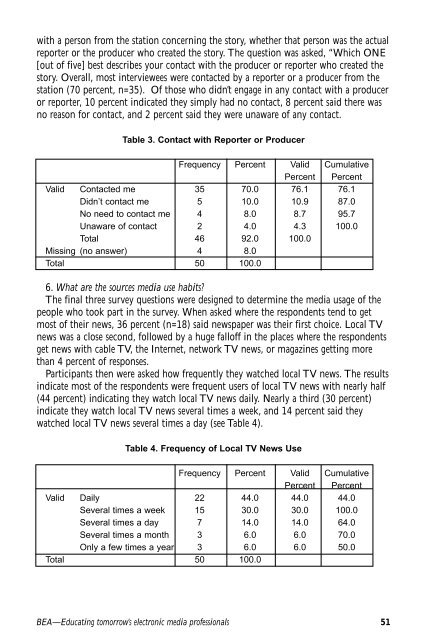
2. How often do news sources complain of more subjective errors in local TV newscastcontent, such as misleading statements, improper emphasis, or insufficient time or detail?This question deals with any area of the incorrect story that may have beenmisleading as opposed to being incorrect. Misleading, of course, is a more subjectivejudgment by the respondent. Again, participants were asked if the story was notentirely correct, what might have made the story misleading. Most respondents (82percent, n= 41) said there was nothing in the story that was misleading, but those whodid find fault gave a number of reasons. The most occurring theme here dealt withcontext. Respondents noted that “quotes were out of context,” and “quotes seemedanti-prayer” (in a school prayer story). Other responses that led to misleading storieswere confusing writing, wrong order of events, and “slant,” an apparent reference toreporter bias.3. What are the error rates across small, medium, and large markets?Conventional thinking might lead one to believe that there would probably be a gapin the number of errors in TV reporting based on market size. After all, younger, lessexperienced reporters and producers are generally hired in smaller markets. As theybecome more experienced and seasoned professionals, they move up through marketswhere mistakes are tolerated less by news directors. Many respondents say that thestories were entirely correct across all three sizes of markets. In large marketsrespondents say stories are either entirely correct or generally correct. The onlygenerally incorrect story was reported in a small market (see Table 2).Table 2. Correctness and Market SizeMarket SizeLarge Medium Small TotalCorrectness Entirely correct 5 11 18 34Generally correct 5 3 7 15Generally incorrect 1 1Total 10 14 26 504. What do sources regard as the likely causes of the errors noted?The fourth area of inquiry sought to determine the cause of errors in the newsstories. Again, only those who cited errors responded to this question. Mostrespondents didn’t place blame for errors (76 percent, n=38), mainly because morereported no errors. Those who did report errors cited a number of reasons, includingmisunderstanding on behalf of the reporter, poor English skills. Frequently blame forerror was put on “reporter bias” or sensationalism.In an attempt to determine whether the story was “complete” all respondents wereasked if the story included sufficient detail. Half of all respondents (50 percent, n=25)simply replied, “Yes.” Only 10 percent (n=5) of the interviewees indicated “No.” Mostof the other respondents indicated the story was generally complete with some sort ofqualifier such as, “Pretty good job,” or “Great detail in interview.”5. What type of contact did the source have with reporters and producers?The study also attempted to deal with the amount of contact the interviewee had50Feedback April 2003 (Vol. 44, No. 2)
with a person from the station concerning the story, whether that person was the actualreporter or the producer who created the story. The question was asked, “Which ONE[out of five] best describes your contact with the producer or reporter who created thestory. Overall, most interviewees were contacted by a reporter or a producer from thestation (70 percent, n=35). Of those who didn’t engage in any contact with a produceror reporter, 10 percent indicated they simply had no contact, 8 percent said there wasno reason for contact, and 2 percent said they were unaware of any contact.Table 3. Contact with Reporter or ProducerFrequency Percent Valid CumulativePercent PercentValid Contacted me 35 70.0 76.1 76.1Didn’t contact me 5 10.0 10.9 87.0No need to contact me 4 8.0 8.7 95.7Unaware of contact 2 4.0 4.3 100.0Total 46 92.0 100.0Missing (no answer) 4 8.0Total 50 100.06. What are the sources media use habits?The final three survey questions were designed to determine the media usage of thepeople who took part in the survey. When asked where the respondents tend to getmost of their news, 36 percent (n=18) said newspaper was their first choice. Local TVnews was a close second, followed by a huge falloff in the places where the respondentsget news with cable TV, the Internet, network TV news, or magazines getting morethan 4 percent of responses.Participants then were asked how frequently they watched local TV news. The resultsindicate most of the respondents were frequent users of local TV news with nearly half(44 percent) indicating they watch local TV news daily. Nearly a third (30 percent)indicate they watch local TV news several times a week, and 14 percent said theywatched local TV news several times a day (see Table 4).Table 4. Frequency of Local TV News UseFrequency Percent Valid CumulativePercent PercentValid Daily 22 44.0 44.0 44.0Several times a week 15 30.0 30.0 100.0Several times a day 7 14.0 14.0 64.0Several times a month 3 6.0 6.0 70.0Only a few times a year 3 6.0 6.0 50.0Total 50 100.0BEA—Educating tomorrow’s electronic media professionals 51
- Page 1 and 2:
Educating tomorrow’selectronic me
- Page 3 and 4: CONTENTSESSAYTransitionsRalph J. Be
- Page 5 and 6: ESSAYTRANSITIONSBy Ralph J. Begleit
- Page 7 and 8: party. It was a fabulous experience
- Page 9 and 10: een accustomed to leaving my “whe
- Page 11 and 12: ADVISING:THE LITTLE SECRET HIDDEN I
- Page 13 and 14: • Total intake model—all studen
- Page 15 and 16: Response to the survey has never re
- Page 17 and 18: assessment of the Center in conclus
- Page 19 and 20: SENSE-MAKING AND THE PERSONALVIDEO
- Page 21 and 22: database. A limited implementation
- Page 23 and 24: RESEARCHTHE PARTICIPATION OF WOMENI
- Page 25 and 26: Local newsroom employmentIn July 20
- Page 27 and 28: the referral source of each person
- Page 30 and 31: Discussion and ConclusionsOur analy
- Page 32 and 33: Lind, R. A., & Braun, M. J. (1996,
- Page 34 and 35: downloading services. www.schoolsuc
- Page 36 and 37: major professional selling points i
- Page 38 and 39: COURSE GRADINGElement Percent of Du
- Page 40 and 41: REVIEWHyde, Stuart (2003). Idea to
- Page 42 and 43: The primary purpose of this study i
- Page 44 and 45: detailing the number of phone numbe
- Page 46 and 47: these newscasts that “primary”
- Page 48 and 49: As Table 1.3 shows, comparing only
- Page 50 and 51: RESEARCHACCURACY IN LOCAL TELEVISIO
- Page 52 and 53: anked 26 to 50. After eliminating n
- Page 56 and 57: Participants were asked which one m
- Page 58 and 59: These stations still archive script
- Page 60 and 61: TABLE 12002 BEA News Division stude
- Page 62 and 63: Eiles at WCHS-TV, Portland, Maine.
- Page 64 and 65: ESSAYWHAT’S OLD IS NEW AGAIN:THE
- Page 66 and 67: are. If the news agency editor or r
- Page 68 and 69: said Sagan, just as broadcast chann
- Page 70 and 71: “We’re perfectly positioned to
- Page 72 and 73: John Miller, News Director of KTVT-
- Page 74 and 75: CLASSROOMGUEST SPEAKERS IN BROADCAS
- Page 76 and 77: students just starting out, their m
- Page 78 and 79: professionals, often with varied jo
- Page 80 and 81: District NewsTo the members of Dist
- Page 82 and 83: several held on college campuses. I
- Page 84 and 85: 2ND PLACE: Jillian Oppegard, Colora
- Page 86 and 87: Faculty News CompetitionC.A. Tuggle
- Page 88 and 89: AWARD OF EXCELLENCE: Kevin Hager, W
- Page 90 and 91: BEA PRESIDENT’S MESSAGEGOALS AND
- Page 92: THANK YOU to the following individu