PLANNING FOR GROWTH IN YEARS OF RESTRICTED RESOURCES
Feedback September 2003 - Broadcast Education Association
Feedback September 2003 - Broadcast Education Association

Create successful ePaper yourself
Turn your PDF publications into a flip-book with our unique Google optimized e-Paper software.
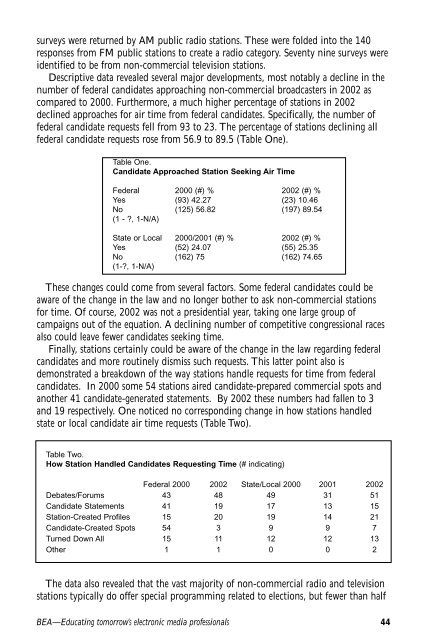
surveys were returned by AM public radio stations. These were folded into the 140responses from FM public stations to create a radio category. Seventy nine surveys wereidentified to be from non-commercial television stations.Descriptive data revealed several major developments, most notably a decline in thenumber of federal candidates approaching non-commercial broadcasters in 2002 ascompared to 2000. Furthermore, a much higher percentage of stations in 2002declined approaches for air time from federal candidates. Specifically, the number offederal candidate requests fell from 93 to 23. The percentage of stations declining allfederal candidate requests rose from 56.9 to 89.5 (Table One).Table One.Candidate Approached Station Seeking Air TimeFederal 2000 (#) % 2002 (#) %Yes (93) 42.27 (23) 10.46No (125) 56.82 (197) 89.54(1 - ?, 1-N/A)State or Local 2000/2001 (#) % 2002 (#) %Yes (52) 24.07 (55) 25.35No (162) 75 (162) 74.65(1-?, 1-N/A)These changes could come from several factors. Some federal candidates could beaware of the change in the law and no longer bother to ask non-commercial stationsfor time. Of course, 2002 was not a presidential year, taking one large group ofcampaigns out of the equation. A declining number of competitive congressional racesalso could leave fewer candidates seeking time.Finally, stations certainly could be aware of the change in the law regarding federalcandidates and more routinely dismiss such requests. This latter point also isdemonstrated a breakdown of the way stations handle requests for time from federalcandidates. In 2000 some 54 stations aired candidate-prepared commercial spots andanother 41 candidate-generated statements. By 2002 these numbers had fallen to 3and 19 respectively. One noticed no corresponding change in how stations handledstate or local candidate air time requests (Table Two).Table Two.How Station Handled Candidates Requesting Time (# indicating)Federal 2000 2002 State/Local 2000 2001 2002Debates/Forums 43 48 49 31 51Candidate Statements 41 19 17 13 15Station-Created Profiles 15 20 19 14 21Candidate-Created Spots 54 3 9 9 7Turned Down All 15 11 12 12 13Other 1 1 0 0 2The data also revealed that the vast majority of non-commercial radio and televisionstations typically do offer special programming related to elections, but fewer than halfBEA—Educating tomorrow’s electronic media professionals 44