ESTUDIO DE MERCADO DE LA VIVIENDA SOCIAL EN LA CIUDAD DE PIURA Y SULLANA
Descargar - Fondo MIVIVIENDA
Descargar - Fondo MIVIVIENDA

Create successful ePaper yourself
Turn your PDF publications into a flip-book with our unique Google optimized e-Paper software.
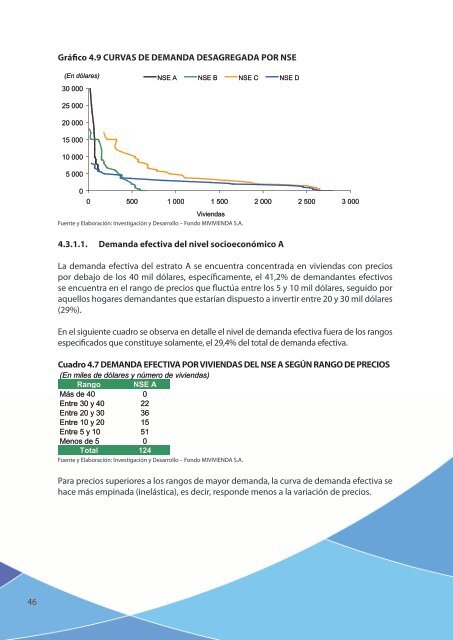
Gráfico 4.9 CURVAS <strong>DE</strong> <strong>DE</strong>MANDA <strong>DE</strong>SAGREGADA POR NSE(En dólares)30 000NSE A NSE B NSE C NSE D25 00020 00015 00010 0005 00000 500 1 000 1 500 2 000 2 500 3 000ViviendasFuente y Elaboración: Investigación y Desarrollo – Fondo MI<strong>VIVI<strong>EN</strong>DA</strong> S.A.4.3.1.1. Demanda efectiva del nivel socioeconómico ALa demanda efectiva del estrato A se encuentra concentrada en viviendas con preciospor debajo de los 40 mil dólares, específicamente, el 41,2% de demandantes efectivosse encuentra en el rango de precios que fluctúa entre los 5 y 10 mil dólares, seguido poraquellos hogares demandantes que estarían dispuesto a invertir entre 20 y 30 mil dólares(29%).En el siguiente cuadro se observa en detalle el nivel de demanda efectiva fuera de los rangosespecificados que constituye solamente, el 29,4% del total de demanda efectiva.Cuadro 4.7 <strong>DE</strong>MANDA EFECTIVA POR <strong>VIVI<strong>EN</strong>DA</strong>S <strong>DE</strong>L NSE A SEGÚN RANGO <strong>DE</strong> PRECIOS(En miles de dólares y número de viviendas)Rango NSE AMás de 40 0Entre 30 y 40 22Entre 20 y 30 36Entre 10 y 20 15Entre 5 y 10 51Menos de 5 0Total 124Fuente y Elaboración: Investigación y Desarrollo – Fondo MI<strong>VIVI<strong>EN</strong>DA</strong> S.A.Para precios superiores a los rangos de mayor demanda, la curva de demanda efectiva sehace más empinada (inelástica), es decir, responde menos a la variación de precios.46