Helsinki Metropolitan Area - Raiffeisen-Leasing
Helsinki Metropolitan Area - Raiffeisen-Leasing
Helsinki Metropolitan Area - Raiffeisen-Leasing

Create successful ePaper yourself
Turn your PDF publications into a flip-book with our unique Google optimized e-Paper software.
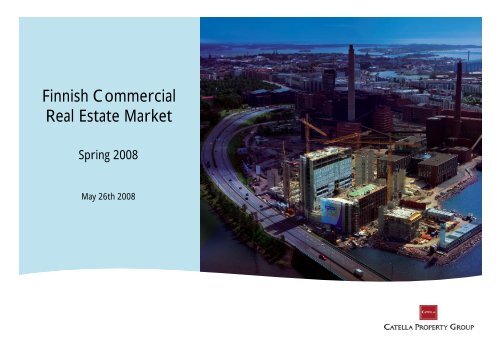
Finnish Commercial<br />
Real Estate Market<br />
Spring 2008<br />
May 26th 2008
Agenda<br />
� Catella in brief<br />
� Finnish Commercial Real Estate Market Spring 2008<br />
a) Fundamentals<br />
b) Letting Market<br />
c) Investment Market<br />
d) Construction and supply<br />
� Is there still opportunities left in the Finnish market ?<br />
2
VI Catella in brief
Dealability 2007<br />
In 2007 Catella Finland served as an advisor in real estate<br />
deals worth over EUR 1.2 billion. The number of deals<br />
completed was over 130.<br />
In addition Catella served as valuation experts in over<br />
EUR 5.0 billion worth of real estate. Catella has assets<br />
under management worth over EUR 600 million.<br />
4
Dealability 2007<br />
5
Catella Property Group<br />
� Catella Property Group is one of the<br />
leading transactions advisors in the<br />
European property market<br />
� 325 dedicated employees in 12<br />
countries.<br />
� During 2004–2007, Catella has acted as<br />
advisor in property transactions in Europe<br />
involving a property value of EUR 40.8<br />
billion.<br />
� In 2007 Catella acted as advisor in major<br />
property transactions and corporate<br />
finance engagements valued at approx. EUR<br />
14.7 billion.<br />
6
Catella Finland<br />
Catella Corporate Finance Oy<br />
Catella Corporate Finance is an<br />
investment bank focusing on:<br />
Property related mergers and<br />
acquisitions<br />
Property portfolio transactions<br />
Deals for large individual properties<br />
Sale-and-leaseback operations<br />
Financial and market advisory services<br />
Property related capital market<br />
transaction<br />
Office in <strong>Helsinki</strong><br />
Catella Property Oy<br />
Transactions (Sales & Letting) provides<br />
service and expertise in individual and<br />
portfolio sales to end-users and investors<br />
Valuation and Consulting provides:<br />
High quality valuation of single assets and<br />
portfolios, making the most of our<br />
experienced professionals and strong local<br />
market knowledge<br />
Property related strategic and financial<br />
analysis<br />
Offices in <strong>Helsinki</strong>, Tampere, Turku, Lahti,<br />
Jyväskylä and Oulu<br />
7<br />
Amplion Asset Management Oy<br />
Long term asset management<br />
partnership for foreign investors in<br />
Finland, Russia and the Baltic countries.<br />
Tailored, creative and value added<br />
solutions for investors.<br />
Full service package from acquisition to<br />
exit<br />
A bridge between international capital<br />
and the local real estate market.<br />
Offices in <strong>Helsinki</strong>, Moscow and St<br />
Petersburg
a) Fundamentals
<strong>Helsinki</strong> is centrally located in the rapidly growing Baltic Sea area<br />
9
Current<br />
ranking<br />
overall<br />
Top Ranking for Finland in European Growth and Monitor benchmark<br />
C ountry<br />
Overall<br />
s core<br />
E conomic<br />
g rowth<br />
Labour<br />
productivity<br />
10<br />
Employment<br />
ratio<br />
Employment<br />
by tertiary<br />
education<br />
level<br />
Investment<br />
ac tivity<br />
(equipment)<br />
Public finance<br />
1 F inland 1.69 1.53 3.05 1.05 1.17 0.71 2.64<br />
2 Ireland 1.44 1.88 2.13 1.03 0.99 0.60 2.04<br />
3 Denmark 1.41 0.73 1.73 1.08 0.91 1.29 2.72<br />
4 S weden 1.40 1.06 2.02 1.08 0.86 1.12 2.28<br />
5 Poland 1.38 2.18 2.60 0.88 0.40 1.00 1.21<br />
6 United Kingdom 1.25 1.05 2.44 1.02 0.94 0.91 1.12<br />
7 Greece 1.23 1.38 2.87 0.94 0.52 1.12 0.52<br />
8 Germany 1.19 1.05 2.14 1.02 0.60 0.91 1.44<br />
9 Netherlands 1.10 1.33 -0.12 1.01 0.90 1.35 1.61<br />
10 S pain 1.10 1.02 1.13 1.09 0.90 0.87 2.13<br />
11 Belgium 1.08 0.92 1.23 0.93 1.13 1.11 1.18<br />
E U15 1.05 0.98 1.35 0.99 0.66 1.03 1.31<br />
12 France 0.94 0.63 1.35 0.97 0.74 1.05 0.91<br />
13 Aus tria 0.88 1.13 0.65 1.05 0.23 0.90 1.33<br />
14 Italy 0.66 0.74 0.53 0.92 0.04 1.14 0.60<br />
S ource: the Lisbon council/Allianz, E uropean Growth and J obs Monitor 2008<br />
European Growth and J obs Monitor<br />
current scoring (2007 Q3)
Seasonably adjusted balances<br />
25<br />
20<br />
15<br />
10<br />
5<br />
0<br />
-5<br />
-10<br />
-15<br />
-20<br />
-25<br />
Consumer and industrial confidence is decreasing, but still considerably over<br />
European average<br />
Consumer Confidence Indicator<br />
01.96 07.96 01.97 07.97 01.98 07.98 01.99 07.99 01.00 07.00 01.01 07.01 01.02 07.02 01.03 07.03 01.04 07.04 01.05 07.05 01.06 07.06 01.07 07.07 01.08<br />
Finland Euro area<br />
Source: European Commission 02/2008<br />
11<br />
25<br />
20<br />
15<br />
10<br />
5<br />
0<br />
-5<br />
- 10<br />
-15<br />
-20<br />
Seasonably adjusted balances<br />
Industrial Confidence Indicator<br />
-25<br />
01.9607.9601.9707.9701.9807.9801.9907.9901.0007.0001.0107.0101.0207.0201.0307.0301.0407.0401.0507.0501.0607.0601.0707.0701.08<br />
Finland Euro area
Economic growth is taking a down turn, Finnish growth still stronger than<br />
European average<br />
GDP forecast<br />
Finland 2008<br />
12<br />
11<br />
10<br />
9<br />
8<br />
7<br />
6<br />
5<br />
4<br />
3<br />
2<br />
1<br />
0<br />
%<br />
Source: SEB 2/2008<br />
Annual change of GDP<br />
Russia Latvia Lithuania Estonia Finland Norway Sweden Denmark Euro-area<br />
2006 Forecast 2007 Forecast 2008<br />
12<br />
Forecast of Finnish GDP<br />
for 2008 considerately<br />
above euro-area average
Finnish economic growth nearly double compared to the Euro area in 1995-2007<br />
and even stronger than in the US<br />
170<br />
160<br />
150<br />
140<br />
130<br />
120<br />
110<br />
100<br />
90<br />
Real GDP Development, Vol. Index 1995 = 100<br />
1995 1996 1997 1998 1999 2000 2001 2002 2003 2004 2005 2006 2007<br />
Source: OECD<br />
Finland Japan United States Euro area<br />
13
Germany, Sweden and Russia the largest export countries<br />
THE FIVE MOST SIGNIFICANT EXPORT COUNTRIES<br />
Million €<br />
8000<br />
7000<br />
6000<br />
5000<br />
4000<br />
3000<br />
2000<br />
1000<br />
0<br />
*Forecast<br />
1995 1996 1997 1998 1999 2000 2001 2002 2003 2004 2005 2006 2007*<br />
Germany Sweden Russia USA UK<br />
Source: National Board of Customs 2/2008 and Catella Property Oy<br />
14
Strong economic growth has accelerated inflation over a 2 % annual level<br />
20<br />
15<br />
10<br />
-5<br />
CONSUMER PRICES, CHANGE FROM PREVIOUS YEAR 1952- 2007<br />
%<br />
5<br />
0<br />
1952<br />
1954<br />
1956<br />
1958<br />
1960<br />
Source: Statistics Finland, 1/2008<br />
1962<br />
1964<br />
1966<br />
1968<br />
1970<br />
1972<br />
1974<br />
1976<br />
1978<br />
1980<br />
15<br />
1982<br />
1984<br />
1986<br />
1988<br />
1990<br />
1992<br />
1994<br />
1996<br />
1998<br />
Euro<br />
2000<br />
2002<br />
2004<br />
2006
GDP volume, GDP and population growth by regional unit in five years<br />
(2000-2005) in major Finnish city areas<br />
Size of the ball = GDP in 2005, millions of euros<br />
16
) Letting market
VACANCY RATE (%) Q4 07<br />
VACANCY RATE IN HELSINKI METROPOLITAN AREA<br />
14<br />
12<br />
10<br />
8<br />
6<br />
4<br />
2<br />
0<br />
%<br />
Q2<br />
90<br />
Q4<br />
90<br />
Q2<br />
91<br />
Q4<br />
91<br />
Q2<br />
92<br />
Q4<br />
92<br />
Q2<br />
93<br />
Q4<br />
93<br />
Q2<br />
94<br />
Q4<br />
94<br />
Q2<br />
95<br />
Q4<br />
95<br />
Q2<br />
96<br />
Q4<br />
96<br />
Q2<br />
97<br />
Q4<br />
97<br />
Q2<br />
98<br />
Q4<br />
98<br />
Q2<br />
99<br />
Q4<br />
99<br />
18<br />
Q2<br />
00<br />
Retail Office Warehouse&industrial All premises together<br />
Q4<br />
00<br />
Q2<br />
01<br />
Q4<br />
01<br />
Q2<br />
02<br />
Q4<br />
02<br />
Q2<br />
03<br />
Q4<br />
03<br />
Q2<br />
04<br />
Q4<br />
04<br />
Q2<br />
05<br />
Q4<br />
05<br />
Q2<br />
06<br />
Q4<br />
06<br />
Q2<br />
07<br />
Q4<br />
07<br />
8,0 %<br />
4,7 %<br />
2,4 %<br />
1,4 %
Vacancy rate development of office premises in selected districts in the <strong>Helsinki</strong><br />
<strong>Metropolitan</strong> <strong>Area</strong> Q2 02 – Q4 07 (excluding Herttoniemi)<br />
% VACANCY RATE OF OFFICE PREMISES IN HMA DISTRICS<br />
20<br />
18<br />
16<br />
14<br />
12<br />
10<br />
8<br />
6<br />
4<br />
2<br />
0<br />
Q2 02 Q4 02 Q2 03 Q4 03 Q2 04 Q4 04 Q2 05 Q4 05 Q2 06 Q4 06 Q2 07 Q4 07<br />
RUOHOLAHTI CBD<br />
LEPPÄVAARA KEILANIEMI / OTANIEMI / POHJOIS TAPIOLA<br />
AIRPORT AREA - AVIAPOLIS<br />
19<br />
3,0%<br />
10,1 %<br />
5,6%<br />
4,80%<br />
1,7 %
<strong>Helsinki</strong> <strong>Metropolitan</strong> <strong>Area</strong> Office Market<br />
Approx. 8,0 million sqm<br />
20
<strong>Helsinki</strong> <strong>Metropolitan</strong> <strong>Area</strong>, Office Market Q4/2007<br />
HELSINKI METROPOLITAN AREA, OFFICE<br />
MARKET<br />
<strong>Helsinki</strong> City Centre<br />
UPPER RENTAL LEVEL*<br />
PRIME YIELD **<br />
OFFICE STOCK,<br />
NET FLOOR AREA<br />
VACANCY RATE<br />
Q2 07 - Q4 07<br />
Q4 07<br />
% - unit<br />
- <strong>Helsinki</strong> CBD €342 m2/year 4,8 - 5,3% 300.000 m2 4,0 % - 1,6%<br />
- <strong>Helsinki</strong> Centre (incl. CBD) n.a. n.a. 1.750.000 m2 4,8 % - 0,5%<br />
Inner City €180 - 240 m2/year 5,5 - 6,5% 2.500.000 m2 7,3 % - 0,1%<br />
Ruoholahti €264 m2/year 5,3 - 5,8 % 300.000 m2 5,6 % - 1,6%<br />
Keilaniemi €264 m2/year 5,2 - 5,8 % 260.000 m2 10,1 % - 4,6%<br />
Espoo West, (modern space) €222 m2/year 5,8 - 6,8 % 350.000 m2 11,2 % + 1,4%<br />
Leppävaara Business Park area €234 m2/year 5,7 - 6,2 % 130.000 m2 3,0 % - 1,6%<br />
Herttoniemi, (modern space) €216 m2/year 5,9 - 6,8 % 100.000 m2 19,2 % - 7,1%<br />
Aviapolis Airport <strong>Area</strong> €234 m2/year 5,7 - 6,5 % 140.000 m2 1,7 % - 2,3%<br />
<strong>Helsinki</strong> <strong>Metropolitan</strong> <strong>Area</strong> n.a. n.a. 8.040.000 m2 8,0 % - 0,4%<br />
*Gross rent **Especially long agreements will lay down yield levels by 0,1 – 0,3 %-points.<br />
21
Shopping centres and retail parks in HMA (gross floor area > 5000m²)<br />
Shopping<br />
Visitors 2007<br />
Shopping centres and retail parks<br />
Existing<br />
Under construction<br />
In planning<br />
Sales 2007 (mil<br />
N:o Centre (mil) EUR)<br />
1 Itäkeskus 22,0 454,0<br />
2 Sello 17,8 322,0<br />
3 Jumbo 8,0 394,0<br />
4 Iso Omena 8,4 212,2<br />
5 Kamppi 30,5 190,0<br />
6 Myyrmanni 6,9 157,2<br />
7 City Forum 13,5 155,0<br />
8 Ruoholahti 3,2 171,8<br />
9 Malmin nova 7,2 82,0<br />
10 Columbus 7,5 92,8<br />
11 Malmintori 7,0** 60,0**<br />
12 Lippulaiva 3,6 65,7<br />
13 Arabia 2,4 44,5<br />
14 Kämp Galleria 2,7 60,0<br />
15 Isomyyri 2,5 32,9<br />
16 Espoontori 3,2 31,1<br />
17 Tikkuri 2,7 29,2<br />
18 Kluuvi 3,1 25,4<br />
19 Heikintori 2,2 27,0<br />
20 Megahertsi 1,5** 22,0**<br />
155,5 2 629<br />
ESPOO<br />
Lommila Retail Park<br />
Petas Retail Park<br />
Viisari<br />
22<br />
Marja-Vantaa<br />
Isomyyri<br />
Myyrmanni<br />
Myyrmanni, extension<br />
Kannelmäki<br />
VANTAA<br />
Retail Park<br />
Vantaanportti<br />
Bauhaus<br />
Plantagen<br />
Jumbo<br />
Koivukylä<br />
Tikkuri<br />
Retail, Tammisto<br />
Malmintori<br />
Retail Park<br />
Porttipuisto<br />
Malmin Nova<br />
Hakunila<br />
Grandis<br />
Glomson Retail Park Galleria<br />
Ogeli<br />
Espoon keskus<br />
Entresse<br />
Espoontori<br />
Grani Sello<br />
Retail Park<br />
Laajalahti<br />
Pitäjänmäki<br />
Super Life Lab<br />
Arabia<br />
HELSINKI<br />
Viikki<br />
Lanterna<br />
Lifestyle Lanterna<br />
Itäkeskus<br />
(Candela)<br />
Columbus<br />
Heikintori<br />
Megahertsi<br />
Heikintori, extension<br />
Kalasatama<br />
Merituuli<br />
Martinsilta<br />
Iso Omena<br />
Iso Omena extension<br />
Plantagen<br />
Bauhaus<br />
City Center<br />
Kaisa<br />
Kampin keskus<br />
Kluuvi<br />
Kämp Galleria<br />
Ruoholahti<br />
Forum Stockmann extension<br />
Lippulaiva<br />
Lippulaiva, extension<br />
Source: Finnish Council of Shopping Centers and Catella Property Oy
Shopping centre sales and attendance level development<br />
Source: Finnish Council of Shopping Centers<br />
2006 2007 2006 2007<br />
Shopping centre Sales (M EUR) Sales (M EUR) Change Attendance M Attendance M<br />
Itäkeskus 439,0 454,0 3 % 22,0 22,0 0 % 1<br />
Jumbo 362,0 394,0 9 % 7,0 8,0 14 % 2<br />
Sello 307,0 322,0 5 % 17,3 17,8 3 % 3<br />
Iso Omena 195,0 212,2 9 % 8,4 8,4 0 % 4<br />
Kampin Keskus* 140,0 190,0 36 % 26,0 30,5 17 % 8<br />
Ruoholahti 148,0 171,8 16 % 3,4 3,2 -6 % 7<br />
Myyrmanni 153,8 157,2 2 % 6,8 6,9 1 % 6<br />
City Forum 152,0 155,0 2 % 14,0 13,5 -4 % 5<br />
Columbus 76,6 92,8 21 % 7,1 7,5 6 % 10<br />
Malmin Nova 78,0 82,0 5 % 6,9 7,2 4 % 9<br />
Lippulaiva 53,0 65,7 24 % 3,0 3,6 20 % 13<br />
Malmintori** 60,0 60,0 0 % 7,0 7,0 0 % 11<br />
Kämp Galleria 57,2 60,0 5 % 3,3 2,7 -18 % 12<br />
Arabia 40,0 44,5 11 % 2,2 2,4 9 % 14<br />
Isomyyri 33,8 32,9 -3 % 2,5 2,5 0 % 15<br />
Espoontori 30,5 31,1 2 % 3,2 3,2 0 % 16<br />
Tikkuri 27,0 29,2 8 % 2,5 2,7 8 % 18<br />
Heikintori 27,0 27,0 0 % 2,2 2,2 0 % 19<br />
Kluuvi 23,0 25,4 10 % 3,7 3,1 -16 % 20<br />
Megahertsi** 22,0 22,0 0 % 1,5 1,5 0 % 21<br />
Galleria 10,0 10,0 0 % 2,0 1,0 -50 % 22<br />
Ogeli 30,0 17<br />
Lanterna 1,2 1,0 -17 % 23<br />
*opened in 2006<br />
**attendance and sales levels from year 2006<br />
23<br />
2006/2007<br />
Change<br />
Previous<br />
rank
Occupied building stock in HMA (retail)<br />
Net floor m²<br />
3 500 000<br />
3 000 000<br />
2 500 000<br />
2 000 000<br />
1 500 000<br />
1 000 000<br />
500 000<br />
-<br />
1997<br />
1997<br />
1998<br />
1998<br />
1999<br />
1999<br />
2000<br />
2000<br />
2001<br />
2001<br />
2002<br />
Q2 Q4 Q2 Q4 Q2 Q4 Q2 Q4 Q2 Q4 Q2 Q4 Q2 Q4 Q2 Q4 Q2 Q4 Q2 Q4 Q2 Q4<br />
24<br />
2002<br />
2003<br />
2003<br />
2004<br />
2004<br />
2005<br />
2005<br />
2006<br />
2006<br />
2007<br />
2007
Occupied building stock in HMA (retail)<br />
Net floor m²<br />
3 500 000<br />
3 000 000<br />
2 500 000<br />
2 000 000<br />
1 500 000<br />
1 000 000<br />
500 000<br />
-<br />
1997<br />
1997<br />
1998<br />
1998<br />
1999<br />
1999<br />
2000<br />
2000<br />
2001<br />
2001<br />
2002<br />
Q2 Q4 Q2 Q4 Q2 Q4 Q2 Q4 Q2 Q4 Q2 Q4 Q2 Q4 Q2 Q4 Q2 Q4 Q2 Q4 Q2 Q4<br />
25<br />
2002<br />
2003<br />
2003<br />
2004<br />
2004<br />
2005<br />
2005<br />
2006<br />
2006<br />
2007<br />
2007
Vacant space Q4 2007 (m 2 )<br />
VACANT SPACE IN HMA<br />
m 2<br />
900000<br />
800000<br />
700000<br />
600000<br />
500000<br />
400000<br />
300000<br />
200000<br />
100000<br />
0<br />
Q2<br />
90<br />
Q4 Q2 Q4<br />
90 91 91<br />
Q2<br />
92<br />
Q4<br />
92<br />
Q2 Q4 Q2<br />
93 93 94<br />
Q4<br />
94<br />
Q2<br />
95<br />
Q4 Q2 Q4 Q2<br />
95 96 96 97<br />
Q4<br />
97<br />
Q2 Q4 Q2 Q4<br />
98 98 99 99<br />
26<br />
Q2<br />
00<br />
Q4 Q2 Q4 Q2<br />
00 01 01 02<br />
Retail Office Warehouse&industrial<br />
December 2000 only 91.000 m2<br />
vacant office space vs. today 640.000 m2<br />
Q4<br />
02<br />
Q2<br />
03<br />
Q4<br />
03<br />
Q2 Q4<br />
04 04<br />
Q2<br />
05<br />
Q4<br />
05<br />
Q2<br />
06<br />
Q4 Q2 Q4<br />
06 07 07
HELSINKI METROPOLITAN AREA<br />
400<br />
350<br />
300<br />
250<br />
200<br />
150<br />
100<br />
50<br />
0<br />
Rental levels of office premises<br />
€/m 2 /year<br />
Q2<br />
89<br />
Q4<br />
89<br />
Q2<br />
90<br />
Q4<br />
90<br />
Q2<br />
91<br />
Q4<br />
91<br />
Q2<br />
92<br />
Q4<br />
92<br />
Q2<br />
93<br />
Q4<br />
93<br />
Q2<br />
94<br />
Q4<br />
94<br />
Q2<br />
95<br />
Q4<br />
95<br />
Q2<br />
96<br />
Q4<br />
96<br />
Q2<br />
97<br />
Q4<br />
97<br />
Q2<br />
98<br />
Q4<br />
98<br />
<strong>Helsinki</strong>, CBD, Prime <strong>Helsinki</strong>, CBD Tapiola Tikkurila<br />
Keilaniemi, Prime Ruoholahti, Prime Aviapolis, Prime<br />
Gross rent € /m 2 /month (excl. VAT), New agreements<br />
27<br />
Q2<br />
99<br />
Q4<br />
99<br />
Q2<br />
00<br />
Q4<br />
00<br />
Q2<br />
01<br />
Q4<br />
01<br />
Q2<br />
02<br />
Q4<br />
02<br />
Q2<br />
03<br />
Q4<br />
03<br />
Q2<br />
04<br />
Q4<br />
04<br />
Q2<br />
05<br />
Q4<br />
05<br />
Q2<br />
06<br />
Q4<br />
06<br />
Q2<br />
07<br />
Q4<br />
07
Vacancy rate vs. rent in some districts in <strong>Helsinki</strong> <strong>Metropolitan</strong> area Q4 2007<br />
Vacancy Rate %<br />
20,0<br />
18,0<br />
16,0<br />
14,0<br />
12,0<br />
10,0<br />
8,0<br />
6,0<br />
4,0<br />
2,0<br />
0,0<br />
Average in<br />
HMA<br />
0 5 10 15 20 25 30<br />
Rent/€/m2/month<br />
28<br />
CBD<br />
Keilaniemi &<br />
Otaniemi<br />
Ruoholahti<br />
Leppävaara<br />
Airport <strong>Area</strong><br />
Herttoniemi<br />
Vallila &<br />
Sörnäinen<br />
Pitäjänmäki
Rental level of warehouse and industrial premises<br />
€ /m 2 /year<br />
125<br />
100<br />
75<br />
50<br />
25<br />
0<br />
<strong>Helsinki</strong> <strong>Metropolitan</strong> <strong>Area</strong><br />
Q4Q2Q4Q2Q4Q2Q4Q2Q4Q2Q4Q2Q4Q2Q4Q2Q4Q2Q4Q2Q4Q2Q4Q2Q4Q2Q4Q2Q4Q2Q4Q2Q4Q2Q4Q2Q4Q2Q4Q2Q4<br />
87 88 88 89 89 90 90 91 91 92 92 93 93 94 94 95 95 96 96 97 97 98 98 99 99 00 00 01 01 02 02 03 03 04 04 05 05 06 06 07 07<br />
Gross rent €/m 2 /year excl. VAT, New Agreements<br />
29
14,0<br />
12,0<br />
10,0<br />
8,0<br />
6,0<br />
4,0<br />
2,0<br />
0,0<br />
Vacancy rate (%) in Finland Q4 07<br />
HELSINKI ESPOO VANTAA TAMPERE TURKU OULU LAHTI KUOPIO JYVÄSKYLÄ VAASA<br />
Retail Office Warehouse&industrial ---Market Balance<br />
30
c) Investment market
EUR bil<br />
6,0<br />
5,0<br />
4,0<br />
3,0<br />
2,0<br />
1,0<br />
0,0<br />
All time high transaction volume in 2007, very active Q1 2008 with 2,0 bn€ volume<br />
Transaction volume in Finland<br />
96 97 98 99 00 01 02 03 04 05 06 07 Q1 08<br />
*) Aleksia sale approx. EUR 1.1 bil<br />
**) Sponda – Kapiteeli deal EUR 1.3 bil<br />
***) CapMan’s hotel portfolio acquisition EUR 800 mil.<br />
*<br />
International Local<br />
32<br />
21%<br />
46%<br />
46%<br />
39%<br />
**<br />
54%<br />
65%<br />
***<br />
52%
Distribution of Real Estate Transactions in Finland 2007, total EUR 6.0 billion<br />
Transaction volumes<br />
EUR 2.9 bil<br />
62 deals<br />
Portfolio<br />
transactions<br />
Single asset<br />
transactions<br />
EUR 3.1 bil<br />
168 deals<br />
33<br />
Regional distribution<br />
<strong>Helsinki</strong> <strong>Metropolitan</strong> <strong>Area</strong><br />
EUR 2.7 bil<br />
45%<br />
EUR 3.3 bil<br />
55%<br />
Outside<br />
<strong>Helsinki</strong> MPA
Transaction volume forecast for Q1 2008 EUR 1.9 billion<br />
EUR mil<br />
1 800<br />
1 600<br />
1 400<br />
1 200<br />
1 000<br />
800<br />
600<br />
400<br />
200<br />
0<br />
Quarterly transaction volume 2006 - Q1 2008<br />
Q1 06 Q2 06 Q3 06 Q4 06 Q1 07 Q2 07 Q3 07 Q4 07 Q1 08<br />
* Sponda’s Kapiteeli acquisition EUR 1.3 bil.<br />
** Citycon’s Iso Omena acquisition EUR 330 mil.<br />
*** CapMan’s hotel portfolio acquisition EUR 800 mil.<br />
*<br />
International Local<br />
34<br />
**<br />
***
Bond rates are descending, whereas bank margins are climbing<br />
%<br />
5,20<br />
5,00<br />
4,80<br />
4,60<br />
4,40<br />
4,20<br />
4,00<br />
3,80<br />
3,60<br />
08 / 07 08 / 07 09 / 07 10 / 07 11 / 07 12 / 07 01 / 08 02 / 08<br />
Source: Bank of Finland and Nordea<br />
SWAP (5 year) Euribor (3 month)<br />
35<br />
Finnish<br />
Government<br />
bonds 5 years<br />
March 27.<br />
3.79 %
Yields of low risk real estate investments are still topping non-risky<br />
bond rate return<br />
The yield gap between real estate and bonds:<br />
<strong>Helsinki</strong> CBD prime office yields (%) – Government bond 10 years (%)<br />
Yield > Bond rate<br />
Yield < Bond rate<br />
+<br />
-<br />
4<br />
3<br />
2<br />
1<br />
0<br />
-1<br />
-2<br />
-3<br />
-4<br />
-5<br />
1995<br />
1996<br />
1997<br />
Source: Bank of Finland and Catella Property Oy<br />
1998<br />
1999<br />
2000<br />
2001<br />
2002<br />
36<br />
2003<br />
2004<br />
2005<br />
2006<br />
2007<br />
2008<br />
March 2008<br />
Prime office yield: 4.80%<br />
10 years bond: - 3.94%<br />
0.82%
Decline of yields is over and the market is in search of a new level. Yields<br />
of the best premises are stable and secondary assets have been reprised<br />
PRIME YIELDS<br />
%<br />
8,5<br />
8,0<br />
7,5<br />
7,0<br />
6,5<br />
6,0<br />
5,5<br />
5,0<br />
4,5<br />
4,0<br />
Q4<br />
85<br />
Source: Catella Property Oy<br />
Q4<br />
86<br />
Q4<br />
87<br />
Q4<br />
88<br />
Q4<br />
89<br />
Q4<br />
90<br />
Q4<br />
91<br />
Q4<br />
92<br />
Q4<br />
93<br />
Q4<br />
94<br />
Q4<br />
95<br />
Q4<br />
96<br />
Q4<br />
97<br />
CBD Leppävaara Ruoholahti Keilaniemi Aviapolis<br />
37<br />
Q4<br />
98<br />
Q4<br />
99<br />
Q4<br />
00<br />
Q4<br />
01<br />
Q4<br />
02<br />
Q4<br />
03<br />
Q4<br />
04<br />
Q4<br />
05<br />
Q4<br />
06<br />
Q4<br />
07
Yield gap between <strong>Helsinki</strong> prime offices and the best premises in Growth cities<br />
is approx. 1.5 percentage-units<br />
%<br />
11,0<br />
10,5<br />
10,0<br />
9,5<br />
9,0<br />
8,5<br />
8,0<br />
7,5<br />
7,0<br />
6,5<br />
6,0<br />
5,5<br />
5,0<br />
4,5<br />
Q2<br />
00<br />
Q4<br />
00<br />
Q2<br />
01<br />
Q4<br />
01<br />
Q2<br />
02<br />
Q4<br />
02<br />
Q2<br />
03<br />
Q4<br />
03<br />
CBD Tampere Turku Oulu Lahti<br />
Kuopio Jyväskylä Vaasa<br />
38<br />
Q2<br />
04<br />
Q4<br />
04<br />
Q2<br />
05<br />
Q4<br />
05<br />
Q2<br />
06<br />
Q4<br />
06<br />
Q2<br />
07<br />
Q4<br />
07
d) Construction and supply
Construction extremely active<br />
%<br />
70,0<br />
60,0<br />
50,0<br />
40,0<br />
30,0<br />
20,0<br />
10,0<br />
0,0<br />
-10,0<br />
-20,0<br />
-30,0<br />
2000 2001 2002 2003 2004 2005 2006 10/2007<br />
Source: Statistics Finland,<br />
volume index (2005=100)<br />
Residential premises Retail and office premises<br />
40
Completed building projects, 1990 – 2008<br />
gross sqm<br />
450 000<br />
400 000<br />
350 000<br />
300 000<br />
250 000<br />
200 000<br />
150 000<br />
100 000<br />
50 000<br />
0<br />
<strong>Helsinki</strong> <strong>Metropolitan</strong> <strong>Area</strong><br />
1990 1991 1992 1993 1994 1995 1996 1997 1998 1999 2000 2001 2002 2003 2004 2005 2006 2007 2008*<br />
Retail Office Industr.&Warehouse<br />
Source: Statistics Finland / KTI and Reed Business Information<br />
41<br />
* Forecast 01/2008<br />
Compare to last peaks!
Building projects completed and under construction in HMA Q4 2007<br />
net floor m2<br />
350000<br />
300000<br />
250000<br />
200000<br />
150000<br />
100000<br />
50000<br />
0<br />
Completed 2007 Under<br />
Construction<br />
* An estimation from what is under construction at the moment<br />
42<br />
Completion 2008* Completion 2009*<br />
Office Retail Logistics
Is there still<br />
opportunities left<br />
in the Finnish<br />
market ?
Already over 70 foreign investors in Finland …is there room for new entries?<br />
31 new international investors in 2002 – 2005 16 new international investors in 2006<br />
� IXIS / AEW (UK,FRA)<br />
� Doughty Hanson (UK)<br />
� IVG (GER)<br />
� London & Regional (UK)<br />
� Gazit Globe (ISR)<br />
� NIAM (SWE)<br />
� iii-Fonds (GER)<br />
� I/S EjendomsInvest (DEN)<br />
� KEOPS (DEN)<br />
� EI Investment (DEN)<br />
� EU Invest (DEN)<br />
� Catella Investments (SWE)<br />
� Cardinal Capital Partners (US)<br />
� RBS (UK)<br />
� Nordica Ejendomme (DEN)<br />
� Aareal Nordic Fund (GER)<br />
� Waterhouse Real Estate (DEN)<br />
� Oppenheim (GER)<br />
� Whitehall (US)<br />
� Teesland IOG (UK)<br />
� Valad Property Group (AUS)<br />
� ABP (NL) � AREEF Fund<br />
� ATP (DEN) � AREFF Fund<br />
� Warburg & Hendersson (GER)<br />
� Sireo Asset Management<br />
� JER EuropeFund II Holdings SARL (US)<br />
� ING REIM (NL)<br />
� AB Sagax (SWE)<br />
� Acta Holding (NOR)<br />
� Retail Holding AS (NOR)<br />
Source: Catella<br />
� DB Real Estate (GER)<br />
� JPMorgan / Genesta (US)<br />
� Rodamco (NL)<br />
� Griffin Eijendomme AS (DEN)<br />
� Merrill Lynch/O’Connor/Genesta (US)<br />
� Pramerica TMW (Prudential) (GER)<br />
� Rockspring (UK)<br />
� LB Immo Invest (GER)<br />
� Cargill (US)<br />
� TK Development (DEN)<br />
� Wereldhave (NL)<br />
� Nordisk Renting (UK)<br />
� Scandrenting (SWE)<br />
� HSH N NF(GER)<br />
� WP Carey (US)<br />
� UBS (SUI)<br />
� The Carlyle Group (US)<br />
� MEAG (GER)<br />
� Union Investment Real Estate AG (GER)<br />
� DEGI (GER)<br />
� Halverton H2O (UK)<br />
� Cordea Savills<br />
Nordic Retail Fund (UK/LU)<br />
� HANSAINVEST (GER)<br />
� Proark Properties ApS (DEN)<br />
� Deka Immobilien (GER)<br />
� ThreadGreen Partners LLP (UK)<br />
� Investea (DEN)<br />
� Protego Real Estate Investors (UK)<br />
44<br />
� Samson Properties (ICE)<br />
� Crownstone European Properties (Cambridge PIM) (UK)<br />
� Schaumann Properties AS (DEN)<br />
� SEB Immobilien Investment GmbH (GER)<br />
� Boultbee (UK)<br />
� Sveafastigheter (SWE)<br />
� NREP (DEN)<br />
� Redevco (NL)<br />
� Norgani Hotels ASA (NOR)<br />
� Kenmore Property Group (UK)<br />
� Delek (ISR)<br />
� Allianz Immobilien GmbH (GER)<br />
� AXA REIM (FRA)<br />
� Property Group A/S (DEN)<br />
� Aberdeen Property Funds<br />
26 new international investors in 2007 2 new international investors in 2008<br />
� GIC Real Estate (SGP)<br />
� GIC Real Estate is an investment company of<br />
Government of Singapore, which acquired 40% of Iso<br />
Omena in February. (EUR 132 mil, yield 4,5 %)<br />
� Protego<br />
�Bought Kamppi Shopping centre for 452 M€, yield 4,5 %
Largest Investors / Sellers in Finland 2007 (according to amount invested / sold)<br />
Investor EUR mil<br />
1. API (UK / FIN) 850<br />
2. Capman (FIN) * 376<br />
3. Citycon (FIN) 329<br />
4. ING (NL) 257<br />
5. Niam (SWE) 247<br />
6. RBS Nordisk Renting (UK) 229<br />
7. Whitehall (UK) 201<br />
8. Samson (ISL) 187<br />
9. AXA (FRA) 179<br />
10. DEGI (GER) 160<br />
11. Boultbee (UK) 145<br />
12. Acta Kapitalförsäkring (NOR) 125<br />
13. EU INVEST (DEN) 107<br />
14. Varma (FIN) 98<br />
15. MEAG (GER) 89<br />
TOTAL 3 579<br />
Source: Company information and Catella research<br />
45<br />
Seller EUR mil<br />
1. Doughty Hanson (UK) 515<br />
2. Ilmarinen (FIN) 415<br />
3. Sponda (FIN) 402<br />
4. YIT (FIN) 323<br />
5. Nordea Rahoitus (FIN) 200<br />
6. Niam (SWE) 198<br />
7. Northern European Properties (UK) 187<br />
8. Palmberg / OKA (FIN) 177<br />
9. Veritas (FIN) 171<br />
10. Sveafastigheter and HGR (SWE / FIN) 154<br />
11. NCC (SWE) 148<br />
12. SRV (FIN) 138<br />
13. Merrill Lynch / O'Connor / Genesta (US) 129<br />
14. Schaumann Investment (DEN) 79<br />
15. Tapiola Group (FIN) 71<br />
TOTAL 3 306
Cycle Clock Q4 2007 (Office premises)<br />
46
<strong>Helsinki</strong> is considered as one of the attractive investment targets with<br />
relatively low risk<br />
47
Conclusions – Finnish Real Estate Market Spring 2008<br />
� Cooling economy - Satisfactory fundamentals compared to average Europe<br />
� Active office construction in <strong>Helsinki</strong> will increase vacancy from 8 % to 9-10 % focusing on old stock<br />
� Transaction volume forecast EUR 4-5 billion – high volume in Q1 2008 but only few deals<br />
� International investors continue to be active - Finland is consistently part of the European investment<br />
market<br />
� Banking system suffers and problems will continue – new sources of financing are needed<br />
� Yields in the best premises are stable – supply limited. Values of secondary assets under pressure - re<br />
pricing evident => back to quality<br />
� Valuation challenge – first time decreasing values in the IFRS environment<br />
� Residential market: No panic – rents are rising and level of new supply is decreasing<br />
� In 2008 delivering returns require active asset management – no more “free lunches”<br />
48
Nordic market one of the three top regions to attract broad range of capital<br />
Almost 50 % of INREV member investors prefer Nordic market<br />
GER Nord. FRA CE RU & UKR CEE TUR UK IT Oth. SPA BE BALT. SWI POR<br />
INREV Investment Intentions Survey 2008<br />
49