

Economic Diversification and Growth
71mK301zeG0
71mK301zeG0

Create successful ePaper yourself
Turn your PDF publications into a flip-book with our unique Google optimized e-Paper software.
Chapter One 7<br />
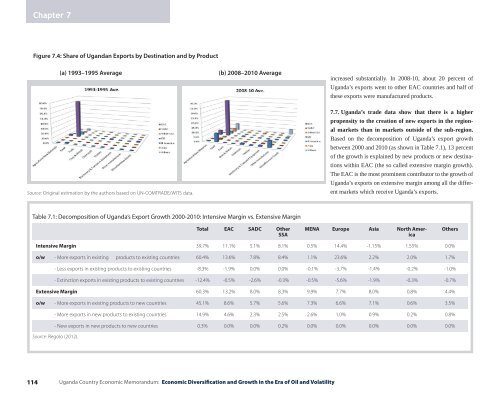
Figure 7.4: Share of Ug<strong>and</strong>an Exports by Destination <strong>and</strong> by Product<br />
(a) 1993–1995 Average<br />
(b) 2008–2010 Average<br />
increased substantially. In 2008-10, about 20 percent of<br />
Ug<strong>and</strong>a’s exports went to other EAC countries <strong>and</strong> half of<br />
these exports were manufactured products.<br />
Source: Original estimation by the authors based on UN-COMTRADE/WITS data.<br />
7.7. Ug<strong>and</strong>a’s trade data show that there is a higher<br />
propensity to the creation of new exports in the regional<br />
markets than in markets outside of the sub-region.<br />
Based on the decomposition of Ug<strong>and</strong>a’s export growth<br />
between 2000 <strong>and</strong> 2010 (as shown in Table 7.1), 13 percent<br />
of the growth is explained by new products or new destinations<br />
within EAC (the so called extensive margin growth).<br />
The EAC is the most prominent contributor to the growth of<br />
Ug<strong>and</strong>a’s exports on extensive margin among all the different<br />
markets which receive Ug<strong>and</strong>a’s exports.<br />
Table 7.1: Decomposition of Ug<strong>and</strong>a’s Export <strong>Growth</strong> 2000-2010: Intensive Margin vs. Extensive Margin<br />
Total EAC SADC Other<br />
SSA<br />
MENA Europe Asia North America<br />
Others<br />
Intensive Margin 39.7% 11.1% 5.1% 8.1% 0.5% 14.4% -1.15% 1.55% 0.0%<br />
o/w - More exports in existing products to existing countries 60.4% 13.6% 7.8% 8.4% 1.1% 23.6% 2.2% 2.0% 1.7%<br />
- Less exports in existing products to existing countries -8.3% -1.9% 0.0% 0.0% -0.1% -3.7% -1.4% -0.2% -1.0%<br />
- Extinction exports in existing products to existing countries -12.4% -0.5% -2.6% -0.3% -0.5% -5.6% -1.9% -0.3% -0.7%<br />
Extensive Margin 60.3% 13.2% 8.0% 8.3% 9.9% 7.7% 8.0% 0.8% 4.4%<br />
o/w - More exports in existing products to new countries 45.1% 8.6% 5.7% 5.6% 7.3% 6.6% 7.1% 0.6% 3.5%<br />
- More exports in new products to existing countries 14.9% 4.6% 2.3% 2.5% 2.6% 1.0% 0.9% 0.2% 0.8%<br />
- New exports in new products to new countries 0.3% 0.0% 0.0% 0.2% 0.0% 0.0% 0.0% 0.0% 0.0%<br />
Source: Regolo (2012).<br />
114<br />
Ug<strong>and</strong>a Country <strong>Economic</strong> Memor<strong>and</strong>um: <strong>Economic</strong> <strong>Diversification</strong> <strong>and</strong> <strong>Growth</strong> in the Era of Oil <strong>and</strong> Volatility