Economic Diversification and Growth
71mK301zeG0
71mK301zeG0
Create successful ePaper yourself
Turn your PDF publications into a flip-book with our unique Google optimized e-Paper software.
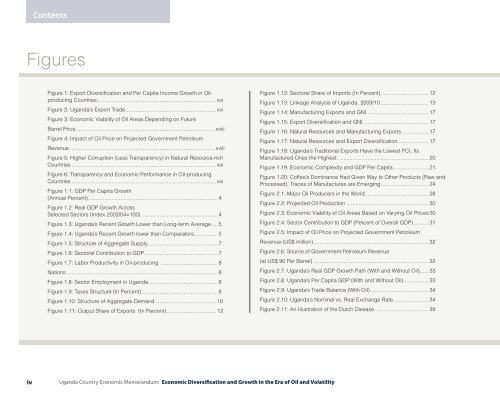
Contents<br />
Figures<br />
Figure 1: Export <strong>Diversification</strong> <strong>and</strong> Per Capita Income <strong>Growth</strong> in Oilproducing<br />
Countries.................................................................................xvi<br />
Figure 2: Ug<strong>and</strong>a’s Export Trade..............................................................xvi<br />
Figure 3: <strong>Economic</strong> Viability of Oil Areas Depending on Future<br />
Barrel Price.............................................................................................. xviii<br />
Figure 4: Impact of Oil Price on Projected Government Petroleum<br />
Revenue.................................................................................................. xviii<br />
Figure 5: Higher Corruption (Less Transparency) in Natural Resource-rich<br />
Countries..................................................................................................xxi<br />
Figure 6: Transparency <strong>and</strong> <strong>Economic</strong> Performance in Oil-producing<br />
Countries..................................................................................................xxi<br />
Figure 1.1: GDP Per Capita <strong>Growth</strong><br />
(Annual Percent)........................................................................................ 4<br />
Figure 1.2: Real GDP <strong>Growth</strong> Across<br />
Selected Sectors (Index 2003/04=100).................................................... 4<br />
Figure 1.3: Ug<strong>and</strong>a’s Recent <strong>Growth</strong> Lower than Long-term Average..... 5<br />
Figure 1.4: Ug<strong>and</strong>a’s Recent <strong>Growth</strong> lower than Comparators................. 5<br />
Figure 1.5: Structure of Aggregate Supply................................................ 7<br />
Figure 1.6: Sectoral Contribution to GDP.................................................. 7<br />
Figure 1.7: Labor Productivity in Oil-producing ....................................... 8<br />
Nations...................................................................................................... 8<br />
Figure 1.8: Sector Employment in Ug<strong>and</strong>a............................................... 8<br />
Figure 1.9: Taxes Structure (In Percent).................................................... 8<br />
Figure 1.10: Structure of Aggregate Dem<strong>and</strong>.......................................... 10<br />
Figure 1.11: Output Share of Exports (In Percent).................................. 12<br />
Figure 1.12: Sectoral Share of Imports (In Percent)................................. 12<br />
Figure 1.13: Linkage Analysis of Ug<strong>and</strong>a, 2009/10................................. 13<br />
Figure 1.14: Manufacturing Exports <strong>and</strong> GNI.......................................... 17<br />
Figure 1.15: Export <strong>Diversification</strong> <strong>and</strong> GNI............................................. 17<br />
Figure 1.16: Natural Resources <strong>and</strong> Manufacturing Exports................... 17<br />
Figure 1.17: Natural Resources <strong>and</strong> Export <strong>Diversification</strong>..................... 17<br />
Figure 1.18: Ug<strong>and</strong>a’s Traditional Exports Have the Lowest PCI, Its<br />
Manufactured Ones the Highest.............................................................. 20<br />
Figure 1.19: <strong>Economic</strong> Complexity <strong>and</strong> GDP Per Capita......................... 21<br />
Figure 1.20: Coffee’s Dominance Had Given Way to Other Products (Raw <strong>and</strong><br />
Processed). Traces of Manufactures are Emerging................................. 24<br />
Figure 2.1: Major Oil Producers in the World........................................... 28<br />
Figure 2.2: Projected Oil Production........................................................ 30<br />
Figure 2.3: <strong>Economic</strong> Viability of Oil Areas Based on Varying Oil Prices.30<br />
Figure 2.4: Sector Contribution to GDP (Percent of Overall GDP)........... 31<br />
Figure 2.5: Impact of Oil Price on Projected Government Petroleum<br />
Revenue (US$ million).............................................................................. 32<br />
Figure 2.6: Source of Government Petroleum Revenue<br />
(at US$ 90 Per Barrel).............................................................................. 32<br />
Figure 2.7: Ug<strong>and</strong>a’s Real GDP <strong>Growth</strong> Path (With <strong>and</strong> Without Oil)....... 33<br />
Figure 2.8: Ug<strong>and</strong>a’s Per Capita GDP (With <strong>and</strong> Without Oil)................. 33<br />
Figure 2.9: Ug<strong>and</strong>a’s Trade Balance (With Oil)........................................ 34<br />
Figure 2.10: Ug<strong>and</strong>a’s Nominal vs. Real Exchange Rate........................ 34<br />
Figure 2.11: An Illustration of the Dutch Disease..................................... 39<br />
iv<br />
Ug<strong>and</strong>a Country <strong>Economic</strong> Memor<strong>and</strong>um: <strong>Economic</strong> <strong>Diversification</strong> <strong>and</strong> <strong>Growth</strong> in the Era of Oil <strong>and</strong> Volatility


