

Economic Diversification and Growth
71mK301zeG0
71mK301zeG0

Create successful ePaper yourself
Turn your PDF publications into a flip-book with our unique Google optimized e-Paper software.
Chapter 2<br />
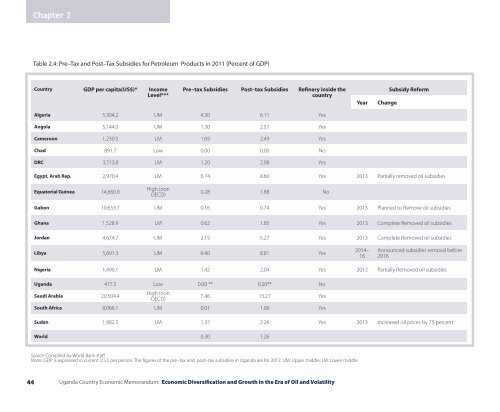
Table 2.4: Pre–Tax <strong>and</strong> Post–Tax Subsidies for Petroleum Products in 2011 (Percent of GDP)<br />
Country GDP per capita(US$)* Income<br />
Level***<br />
Pre–tax Subsidies Post–tax Subsidies Refinery inside the<br />
country<br />
Year<br />
Change<br />
Subsidy Reform<br />
Algeria 5,304.2 UM 4.30 6.11 Yes<br />
Angola 5,144.0 UM 1.30 2.51 Yes<br />
Cameroon 1,230.5 LM 1.69 2.49 Yes<br />
Chad 891.7 Low 0.00 0.00 No<br />
DRC 3,713.8 LM 1.20 2.08 Yes<br />
Egypt, Arab Rep. 2,970.4 LM 6.74 8.60 Yes 2013 Partially removed oil subsidies<br />
Equatorial Guinea 14,660.8<br />
High (non<br />
OECD)<br />
0.28 1.88 No<br />
Gabon 10,653.7 UM 0.16 0.74 Yes 2013 Planned to Remove oil subsidies<br />
Ghana 1,528.9 LM 0.62 1.85 Yes 2013 Complete Removed oil subsidies<br />
Jordan 4,674.7 UM 2.15 5.27 Yes 2013 Complete Removed oil subsidies<br />
Libya 5,691.3 UM 6.40 8.81 Yes<br />
2014–<br />
16<br />
Announced subsidies removal before<br />
2016<br />
Nigeria 1,490.1 LM 1.42 2.04 Yes 2012 Partially Removed oil subsidies<br />
Ug<strong>and</strong>a 477.5 Low 0.00 ** 0.20** No<br />
Saudi Arabia 20,504.4<br />
High (non<br />
OECD)<br />
7.46 13.27 Yes<br />
South Africa 8,066.1 UM 0.01 1.06 Yes<br />
Sudan 1,982.5 LM 1.37 2.26 Yes 2013 Increased oil prices by 75 percent<br />
World 0.30 1.26<br />
Source: Compiled by World Bank staff.<br />
Notes: GDP is expressed in current U.S.$ per person. The figures of the pre–tax <strong>and</strong> post–tax subsidies in Ug<strong>and</strong>a are for 2012. UM: Upper middle; LM: Lower middle.<br />
44<br />
Ug<strong>and</strong>a Country <strong>Economic</strong> Memor<strong>and</strong>um: <strong>Economic</strong> <strong>Diversification</strong> <strong>and</strong> <strong>Growth</strong> in the Era of Oil <strong>and</strong> Volatility