

Economic Diversification and Growth
71mK301zeG0
71mK301zeG0

Create successful ePaper yourself
Turn your PDF publications into a flip-book with our unique Google optimized e-Paper software.
Chapter One 1<br />
Key Messages <strong>and</strong> Conclusions:<br />
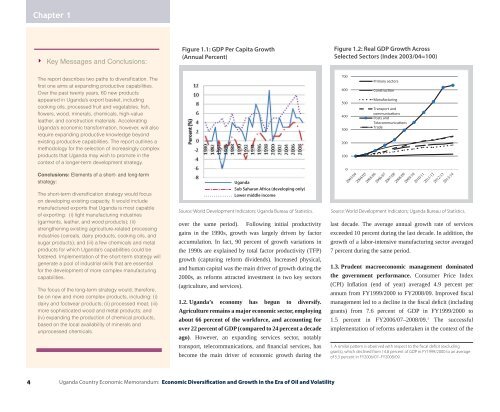
Figure 1.1: GDP Per Capita <strong>Growth</strong><br />
(Annual Percent)<br />
Figure 1.2: Real GDP <strong>Growth</strong> Across<br />
Selected Sectors (Index 2003/04=100)<br />
The report describes two paths to diversification. The<br />
first one aims at exp<strong>and</strong>ing productive capabilities.<br />
Over the past twenty years, 60 new products<br />
appeared in Ug<strong>and</strong>a’s export basket, including<br />
cooking oils, processed fruit <strong>and</strong> vegetables, fish,<br />
flowers, wood, minerals, chemicals, high-value<br />
leather, <strong>and</strong> construction materials. Accelerating<br />
Ug<strong>and</strong>a’s economic transformation, however, will also<br />
require exp<strong>and</strong>ing productive knowledge beyond<br />
existing productive capabilities. The report outlines a<br />
methodology for the selection of increasingly complex<br />
products that Ug<strong>and</strong>a may wish to promote in the<br />
context of a longer-term development strategy.<br />
Conclusions: Elements of a short- <strong>and</strong> long-term<br />
strategy:<br />
The short-term diversification strategy would focus<br />
on developing existing capacity. It would include<br />
manufactured exports that Ug<strong>and</strong>a is most capable<br />
of exporting: (i) light manufacturing industries<br />
(garments, leather, <strong>and</strong> wood products); (ii)<br />
strengthening existing agriculture-related processing<br />
industries (cereals, dairy products, cooking oils, <strong>and</strong><br />
sugar products); <strong>and</strong> (iii) a few chemicals <strong>and</strong> metal<br />
products for which Ug<strong>and</strong>a’s capabilities could be<br />
fostered. Implementation of the short-term strategy will<br />
generate a pool of industrial skills that are essential<br />
for the development of more complex manufacturing<br />
capabilities.<br />
The focus of the long-term strategy would, therefore,<br />
be on new <strong>and</strong> more complex products, including: (i)<br />
dairy <strong>and</strong> footwear products; (ii) processed meat; (iii)<br />
more sophisticated wood <strong>and</strong> metal products; <strong>and</strong><br />
(iv) exp<strong>and</strong>ing the production of chemical products,<br />
based on the local availability of minerals <strong>and</strong><br />
unprocessed chemicals.<br />
Ug<strong>and</strong>a<br />
Sub Saharan Africa (developing only)<br />
Lower middle income<br />
Source: World Development Indicators; Ug<strong>and</strong>a Bureau of Statistics.<br />
over the same period). Following initial productivity<br />
gains in the 1990s, growth was largely driven by factor<br />
accumulation. In fact, 90 percent of growth variations in<br />
the 1990s are explained by total factor productivity (TFP)<br />
growth (capturing reform dividends). Increased physical,<br />
<strong>and</strong> human capital was the main driver of growth during the<br />
2000s, as reforms attracted investment in two key sectors<br />
(agriculture, <strong>and</strong> services).<br />
1.2. Ug<strong>and</strong>a’s economy has begun to diversify.<br />
Agriculture remains a major economic sector, employing<br />
about 66 percent of the workforce, <strong>and</strong> accounting for<br />
over 22 percent of GDP (compared to 24 percent a decade<br />
ago). However, an exp<strong>and</strong>ing services sector, notably<br />
transport, telecommunications, <strong>and</strong> financial services, has<br />
become the main driver of economic growth during the<br />
Source: World Development Indicators; Ug<strong>and</strong>a Bureau of Statistics.<br />
last decade. The average annual growth rate of services<br />
exceeded 10 percent during the last decade. In addition, the<br />
growth of a labor-intensive manufacturing sector averaged<br />
7 percent during the same period.<br />
1.3. Prudent macroeconomic management dominated<br />
the government performance. Consumer Price Index<br />
(CPI) Inflation (end of year) averaged 4.9 percent per<br />
annum from FY1999/2000 to FY2008/09. Improved fiscal<br />
management led to a decline in the fiscal deficit (including<br />
grants) from 7.6 percent of GDP in FY1999/2000 to<br />
1.5 percent in FY2006/07–2008/09. 1 The successful<br />
implementation of reforms undertaken in the context of the<br />
1. A similar pattern is observed with respect to the fiscal deficit (excluding<br />
grants), which declined from 14.8 percent of GDP in FY1999/2000 to an average<br />
of 5.3 percent in FY2006/07–FY2008/09.<br />
4<br />
Ug<strong>and</strong>a Country <strong>Economic</strong> Memor<strong>and</strong>um: <strong>Economic</strong> <strong>Diversification</strong> <strong>and</strong> <strong>Growth</strong> in the Era of Oil <strong>and</strong> Volatility