

Annual Report
Ausgrid%20AR%202015
Ausgrid%20AR%202015

You also want an ePaper? Increase the reach of your titles
YUMPU automatically turns print PDFs into web optimized ePapers that Google loves.
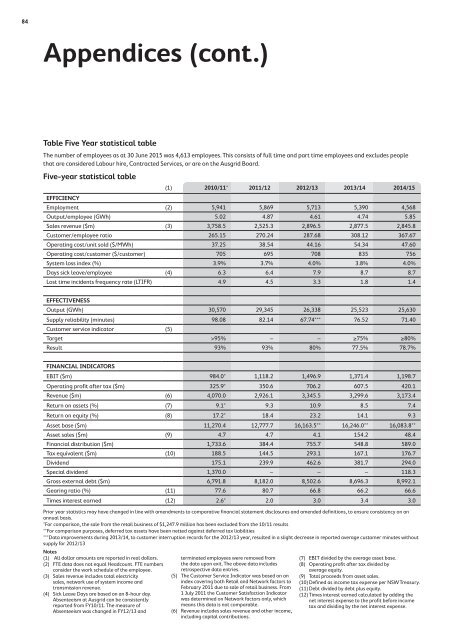
84<br />
Appendices (cont.)<br />
Table Five Year statistical table<br />
The number of employees as at 30 June 2015 was 4,613 employees. This consists of full time and part time employees and excludes people<br />
that are considered Labour hire, Contracted Services, or are on the Ausgrid Board.<br />
Five-year statistical table<br />
EFFICIENCY<br />
(1) 2010/11* 2011/12 2012/13 2013/14 2014/15<br />
Employment (2) 5,941 5,869 5,713 5,390 4,568<br />
Output/employee (GWh) 5.02 4.87 4.61 4.74 5.85<br />
Sales revenue ($m) (3) 3,758.5 2,525.3 2,896.5 2,877.5 2,845.8<br />
Customer/employee ratio 265.15 270.24 287.68 308.12 367.67<br />
Operating cost/unit sold ($/MWh) 37.25 38.54 44.16 54.34 47.60<br />
Operating cost/customer ($/customer) 705 695 708 835 756<br />
System loss index (%) 3.9% 3.7% 4.0% 3.8% 4.0%<br />
Days sick leave/employee (4) 6.3 6.4 7.9 8.7 8.7<br />
Lost time incidents frequency rate (LTIFR) 4.9 4.5 3.3 1.8 1.4<br />
EFFECTIVENESS<br />
Output (GWh) 30,570 29,345 26,338 25,523 25,630<br />
Supply reliability (minutes) 98.08 82.14 67.74*** 76.52 71.40<br />
Customer service indicator (5)<br />
Target >95% – – ≥75% ≥80%<br />
Result 93% 93% 80% 77.5% 78.7%<br />
FINANCIAL INDICATORS<br />
EBIT ($m) 984.0* 1,118.2 1,496.9 1,371.4 1,198.7<br />
Operating profit after tax ($m) 325.9* 350.6 706.2 607.5 420.1<br />
Revenue ($m) (6) 4,070.0 2,926.1 3,345.5 3,299.6 3,173.4<br />
Return on assets (%) (7) 9.1* 9.3 10.9 8.5 7.4<br />
Return on equity (%) (8) 17.2* 18.4 23.2 14.1 9.3<br />
Asset base ($m) 11,270.4 12,777.7 16,163.5** 16,246.0** 16,083.8**<br />
Asset sales ($m) (9) 4.7 4.7 4.1 154.2 48.4<br />
Financial distribution ($m) 1,733.6 384.4 755.7 548.8 589.0<br />
Tax equivalent ($m) (10) 188.5 144.5 293.1 167.1 176.7<br />
Dividend 175.1 239.9 462.6 381.7 294.0<br />
Special dividend 1,370.0 – – – 118.3<br />
Gross external debt ($m) 6,791.8 8,182.0 8,502.6 8,696.3 8,992.1<br />
Gearing ratio (%) (11) 77.6 80.7 66.8 66.2 66.6<br />
Times interest earned (12) 2.6* 2.0 3.0 3.4 3.0<br />
Prior year statistics may have changed in line with amendments to comparative financial statement disclosures and amended definitions, to ensure consistency on an<br />
annual basis.<br />
*For comparison, the sale from the retail business of $1,247.9 million has been excluded from the 10/11 results<br />
**For comparison purposes, deferred tax assets have been netted against deferred tax liabilities<br />
***Data improvements during 2013/14, to customer interruption records for the 2012/13 year, resulted in a slight decrease in reported average customer minutes without<br />
supply for 2012/13<br />
Notes<br />
(1) All dollar amounts are reported in real dollars.<br />
(2) FTE data does not equal Headcount. FTE numbers<br />
consider the work schedule of the employee.<br />
(3) Sales revenue includes total electricity<br />
sales, network use of system income and<br />
transmission revenue.<br />
(4) Sick Leave Days are based on an 8-hour day.<br />
Absenteeism at Ausgrid can be consistently<br />
reported from FY10/11. The measure of<br />
Absenteeism was changed in FY12/13 and<br />
terminated employees were removed from<br />
the data upon exit. The above data includes<br />
retrospective data entries.<br />
(5) The Customer Service Indicator was based on an<br />
index covering both Retail and Network factors to<br />
February 2011 due to sale of retail business. From<br />
1 July 2011 the Customer Satisfaction Indicator<br />
was determined on Network factors only, which<br />
means this data is not comparable.<br />
(6) Revenue includes sales revenue and other income,<br />
including capital contributions.<br />
(7) EBIT divided by the average asset base.<br />
(8) Operating profit after tax divided by<br />
average equity.<br />
(9) Total proceeds from asset sales.<br />
(10) Defined as income tax expense per NSW Treasury.<br />
(11) Debt divided by debt plus equity.<br />
(12) Times interest earned calculated by adding the<br />
net interest expense to the profit before income<br />
tax and dividing by the net interest expense.