- Page 1 and 2: Domain Testing: Divide and Conquer
- Page 3 and 4: We the undersigned committee hereby
- Page 5 and 6: Table of Contents Chapter 1: Introd
- Page 7 and 8: Chapter 3: Instructional Design and
- Page 9 and 10: 5.04 Facilities Used for the Experi
- Page 11 and 12: List of Tables Table 6.01 Question
- Page 13 and 14: Acknowledgements • Dr. Cem Kaner,
- Page 15 and 16: 1.01 Problem Description Chapter 1:
- Page 17 and 18: There are two general approaches to
- Page 19 and 20: effective testing with reduced effo
- Page 21 and 22: Other researchers have used the fea
- Page 23 and 24: July 22, 2003; Frankl, Hamlet, Litt
- Page 25 and 26: Chapter 2: Domain Testing: A Litera
- Page 27 and 28: Black-box testers may or may not re
- Page 29 and 30: For instance, in the above example,
- Page 31 and 32: Myers (1979) suggested associating
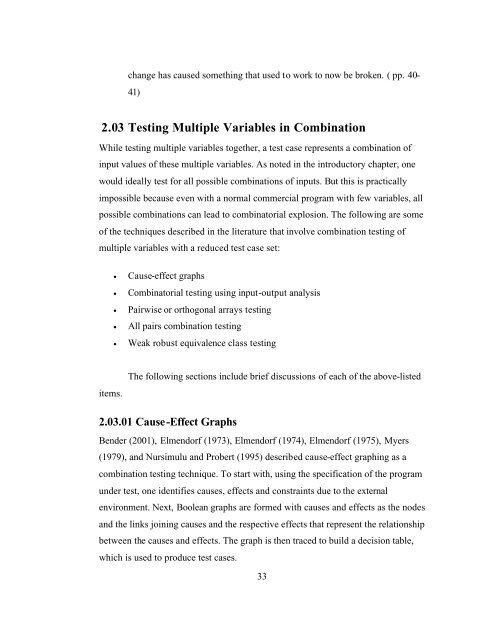
- Page 33 and 34: In the functional approach to doing
- Page 35 and 36: in the correctness of the program.
- Page 37 and 38: Whittaker and Jorgensen (2002) desc
- Page 39 and 40: listed above. o Worst Case Testing
- Page 41 and 42: He referred to the number of test c
- Page 43 and 44: Hutcheson (2003) described boundary
- Page 45: 2.02.03.02 Special Value Testing Jo
- Page 49 and 50: Hence, a row in an orthogonal array
- Page 51 and 52: combinations of valid equivalence c
- Page 53 and 54: Chapter 3: Instructional Design and
- Page 55 and 56: Carey, 1985; Dick et al., 2001; Dri
- Page 57 and 58: and how they apply the knowledge. T
- Page 59 and 60: Keeping the questionnaires anonymou
- Page 61 and 62: objectives of the instruction. Bein
- Page 63 and 64: software testing courses before, si
- Page 65 and 66: accomplished learning. This also he
- Page 67 and 68: available and integrate them with t
- Page 69 and 70: substance of the materials to make
- Page 71 and 72: 4. Expertise-oriented approaches, w
- Page 73 and 74: specifically said, “A pretest is
- Page 75 and 76: instructional design itself. Accord
- Page 77 and 78: • Appendix G: Day 2 Lecture • A
- Page 79 and 80: • Reference materials • Linking
- Page 81 and 82: Every exercise question and every q
- Page 83 and 84: Chapter 5: Experiment Design 5.01 O
- Page 85 and 86: This first version of the advertise
- Page 87 and 88: o Numeric variables � Integer �
- Page 89 and 90: learners should be sufficient to te
- Page 91 and 92: Standard Deviation: “A measure de
- Page 93 and 94: Question 2 (10 points): • Test A:
- Page 95 and 96: Question 3 (10 points): • Test A:
- Page 97 and 98:
Question 4 (10 points): • Test A:
- Page 99 and 100:
Question 5 (5 points): • Test A:
- Page 101 and 102:
Question 6 (10 points): • Test A:
- Page 103 and 104:
Question 7 (15 points): • Test A:
- Page 105 and 106:
Question 8 (15 points): • Test A:
- Page 107 and 108:
Question 9 (15 points): • Test A:
- Page 109 and 110:
Table 6.10: Final Scores - Pretest
- Page 111 and 112:
Chart 6.01: Paper-Based Pretest and
- Page 113 and 114:
6.02 Performance Test Results Appen
- Page 115 and 116:
11 12 0 0 9. How would you rate you
- Page 117 and 118:
commented that they liked the fact
- Page 119 and 120:
11. What was the least useful part
- Page 121 and 122:
appreciated the fact that a lot of
- Page 123 and 124:
Most of them commented that they be
- Page 125 and 126:
48% Q4: How would you rate your ove
- Page 127 and 128:
Chapter 7: Conclusion 7.01 Domain T
- Page 129 and 130:
7.01.02 Minuses Kaner (2003) also c
- Page 131 and 132:
work is strong evidence that the st
- Page 133 and 134:
Boland, P. J., Singh, H., & Cukic,
- Page 135 and 136:
Clarke, L. A., Hassell, J., & Richa
- Page 137 and 138:
Hajnal, À., & Forgács, I. (1998).
- Page 139 and 140:
Jeng, B., & Weyuker, E. J. (1994, J
- Page 141 and 142:
Mayrhauser, A. V., Walls, J., & Mra
- Page 143 and 144:
Schroeder, P. J., & Korel, B. (2000
- Page 145 and 146:
Zhu, H., Hall, P. A. V., & May, J.
- Page 147 and 148:
Appendix A: Reference Material# 1 f
- Page 149 and 150:
What is an input variable? An input
- Page 151 and 152:
Step 6: Determine whether the varia
- Page 153 and 154:
Domain Testing Equivalence Class an
- Page 155 and 156:
Partition the input domain into dif
- Page 157 and 158:
domain specific special condition b
- Page 159 and 160:
Appendix C: Reference Material# 3 f
- Page 161 and 162:
What is All-Pairs Combination Testi
- Page 163 and 164:
If ‘n’ is the total number of v
- Page 165 and 166:
Step 3: Step 4: Step 5: Test case#
- Page 167 and 168:
Test case# a(3) b(2) c(2) d(2) e(2)
- Page 169 and 170:
Step 9: • The only two pairs miss
- Page 171 and 172:
Appendix D: Equivalence Class Analy
- Page 173 and 174:
Appendix A: Equivalence Class Analy
- Page 175 and 176:
Appendix A: Equivalence Class Analy
- Page 177 and 178:
Appendix A: Equivalence Class Analy
- Page 179 and 180:
Appendix A: Equivalence Class Analy
- Page 181 and 182:
Appendix A: Equivalence Class Analy
- Page 183 and 184:
Appendix E: Guidelines for All-Pair
- Page 185 and 186:
Appendix B: Guidelines for filling
- Page 187 and 188:
Appendix F: Day 1 Lecture (Introduc
- Page 189 and 190:
Why do we need to test software? To
- Page 191 and 192:
Analysis To assert that the output
- Page 193 and 194:
Analysis The total possible combina
- Page 195 and 196:
What is Domain Testing? Domain test
- Page 197 and 198:
Domain testing-Terminology Boundary
- Page 199 and 200:
Summary Our goal is to not only do
- Page 201 and 202:
Session 2: Domain Testing Sowmya Pa
- Page 203 and 204:
Testing Integer fields � Example
- Page 205 and 206:
Testing Integer fields Example 1
- Page 207 and 208:
Testing Integer fields Example 1
- Page 209 and 210:
Testing Integer fields Example 1
- Page 211 and 212:
Variable(s) Equivalence Class(es)
- Page 213 and 214:
Testing Integer fields Example 2
- Page 215 and 216:
Testing Integer fields Example 2
- Page 217 and 218:
Testing Integer fields Example 2
- Page 219 and 220:
Testing Integer fields Example 2 St
- Page 221 and 222:
© Sowmya Padmanabhan, 2003 19
- Page 223 and 224:
Word Problems � Example 3: SunTru
- Page 225 and 226:
Word Problems Example 3 � Credit
- Page 227 and 228:
Word Problems Example 3 � ‘cred
- Page 229 and 230:
Word Problems Example 3 � $400
- Page 231 and 232:
Word Problems Example 3 � The inp
- Page 233 and 234:
Word Problems Example 3 � Failure
- Page 235 and 236:
Variable(s) Equivalence Class(es)
- Page 237 and 238:
Word Problems Example 4 � Step 1:
- Page 239 and 240:
Word Problems Example 4 � Step 2:
- Page 241 and 242:
Word Problems Example 4 � Step 3:
- Page 243 and 244:
Word Problems Example 4 � Step 4:
- Page 245 and 246:
Word Problems Example 4 � Step 5:
- Page 247 and 248:
Word Problems Example 4 Step 6: Par
- Page 249 and 250:
Word Problems � Example 5: The pa
- Page 251 and 252:
Word Problems Example 5 � User, P
- Page 253 and 254:
Word Problems Example 5 � ‘widt
- Page 255 and 256:
Word Problems Example 5 � 1
- Page 257 and 258:
Word Problems Example 5 � The inp
- Page 259 and 260:
Word Problems Example 5 � Failure
- Page 261 and 262:
Variable (s) ‘width’ Equivalenc
- Page 263 and 264:
Testing multiple ranges � The pro
- Page 265 and 266:
Testing multiple ranges Example 6
- Page 267 and 268:
Word Problems Example 6 � Step 1:
- Page 269 and 270:
Word Problems Example 6 � Step 2:
- Page 271 and 272:
Word Problems Example 6 � Step 3:
- Page 273 and 274:
Word Problems Example 6 � Step 4:
- Page 275 and 276:
Word Problems Example 6 � Step 5:
- Page 277 and 278:
Word Problems Example 6 Step 6: Par
- Page 279 and 280:
Analyzing non-numbers � Let us fi
- Page 281 and 282:
Standard ASCII The first 32 charact
- Page 283 and 284:
52 4 53 5 54 6 55 7 56 8 57 9 58 :
- Page 285 and 286:
108 l 109 m 110 n 111 o 112 p 113 q
- Page 287 and 288:
ASCII characters � ASCII files:
- Page 289 and 290:
Why bother about ASCII characters i
- Page 291 and 292:
Analyzing non-numbers Example 6 �
- Page 293 and 294:
Analyzing non-numbers Example 6 Par
- Page 295 and 296:
Variable Equivalence classes tax-in
- Page 297 and 298:
Testing String fields � We encoun
- Page 299 and 300:
Testing String fields Example 7 �
- Page 301 and 302:
Testing String fields Example 7 �
- Page 303 and 304:
Testing String fields Example 7 �
- Page 305 and 306:
Testing String fields Example 7 Ste
- Page 307 and 308:
© Sowmya Padmanabhan, 2003 92
- Page 309 and 310:
25 EM End of medium 26 SUB Substitu
- Page 311 and 312:
80 P 81 Q 82 R 83 S 84 T 85 U 86 V
- Page 313 and 314:
Extended ASCII Characters Reference
- Page 315 and 316:
Session 3: Domain Testing Sowmya Pa
- Page 317 and 318:
Testing multidimensional variables
- Page 319 and 320:
Testing multidimensional variables
- Page 321 and 322:
General analysis of multidimensiona
- Page 323 and 324:
Multidimensional numeric fields Exa
- Page 325 and 326:
Multidimensional numeric fields Exa
- Page 327 and 328:
Multidimensional numeric fields Exa
- Page 329 and 330:
Multidimensional numeric fields Exa
- Page 331 and 332:
Multidimensional numeric fields Exa
- Page 333 and 334:
© Sowmya Padmanabhan, 2003 19
- Page 335 and 336:
Multidimensional string fields Exam
- Page 337 and 338:
Multidimensional string fields Exam
- Page 339 and 340:
Multidimensional string fields Exam
- Page 341 and 342:
Multidimensional string fields Exam
- Page 343 and 344:
Multidimensional string fields Exam
- Page 345 and 346:
Multidimensional string fields �
- Page 347 and 348:
Multidimensional string fields Exam
- Page 349 and 350:
Multidimensional string fields Exam
- Page 351 and 352:
Multidimensional string fields Exam
- Page 353 and 354:
Multidimensional string fields Exam
- Page 355 and 356:
Multidimensional string fields Exam
- Page 357 and 358:
Multidimensional string fields Exam
- Page 359 and 360:
Multidimensional string fields Exam
- Page 361 and 362:
Testing Enumerated fields � Range
- Page 363 and 364:
Testing Enumerated fields � Examp
- Page 365 and 366:
Testing Enumerated fields Example 4
- Page 367 and 368:
Testing Enumerated fields Example 4
- Page 369 and 370:
Testing Enumerated fields Example 4
- Page 371 and 372:
© Sowmya Padmanabhan, 2003 57
- Page 373 and 374:
Identifying variables of a given pr
- Page 375 and 376:
Identifying variables of a given pr
- Page 377 and 378:
Identifying variables of a given pr
- Page 379 and 380:
Identifying variables of a given pr
- Page 381 and 382:
Identifying variables of a given pr
- Page 383 and 384:
Identifying variables of a given pr
- Page 385 and 386:
Identifying variables of a given pr
- Page 387 and 388:
Developing test cases for given pro
- Page 389 and 390:
Developing test cases for given pro
- Page 391 and 392:
Developing test cases for given pro
- Page 393 and 394:
Developing test cases for given pro
- Page 395 and 396:
Developing test cases for given pro
- Page 397 and 398:
Developing test cases for given pro
- Page 399 and 400:
Developing test cases for given pro
- Page 401 and 402:
Developing test cases for given pro
- Page 403 and 404:
Developing test cases for given pro
- Page 405 and 406:
Developing test cases for given pro
- Page 407 and 408:
Developing test cases for given pro
- Page 409 and 410:
Developing test cases for given pro
- Page 411 and 412:
© Sowmya Padmanabhan, 2003 97
- Page 413 and 414:
Developing test cases for given pro
- Page 415 and 416:
Developing test cases for given pro
- Page 417 and 418:
Developing test cases for given pro
- Page 419 and 420:
Developing test cases for given pro
- Page 421 and 422:
Developing test cases for given pro
- Page 423 and 424:
Developing test cases for given pro
- Page 425 and 426:
Developing test cases for given pro
- Page 427 and 428:
Developing test cases for given pro
- Page 429 and 430:
Developing test cases for given pro
- Page 431 and 432:
© Sowmya Padmanabhan, 2003 117
- Page 433 and 434:
Variable Dimension Equivalence clas
- Page 435 and 436:
Variable Dimension Equivalence clas
- Page 437 and 438:
Look In Variable Equivalence classe
- Page 439 and 440:
For ASCII sub-range of allowed grou
- Page 441 and 442:
Files of Type Variable Equivalence
- Page 443 and 444:
Appendix I: Day 4 Lecture (Day 4 Le
- Page 445 and 446:
Testing in combination-Why? � All
- Page 447 and 448:
All possible combinations testing
- Page 449 and 450:
All-Pairs Combination Testing � M
- Page 451 and 452:
All-Pairs Combination Testing � I
- Page 453 and 454:
All-Pairs Combination Testing � 7
- Page 455 and 456:
All-Pairs Combination Testing Examp
- Page 457 and 458:
All-Pairs Combination Testing Examp
- Page 459 and 460:
All-Pairs Combination Testing Examp
- Page 461 and 462:
All-Pairs Combination Testing Examp
- Page 463 and 464:
All-Pairs Combination Testing Examp
- Page 465 and 466:
All-Pairs Combination Testing Examp
- Page 467 and 468:
All-Pairs Combination Testing Examp
- Page 469 and 470:
All-Pairs Combination Testing Examp
- Page 471 and 472:
All-Pairs Combination Testing Examp
- Page 473 and 474:
All-Pairs Combination Testing Examp
- Page 475 and 476:
Application of all-pairs combinatio
- Page 477 and 478:
All-Pairs Combination Testing Examp
- Page 479 and 480:
All-Pairs Combination Testing Examp
- Page 481 and 482:
All-Pairs Combination Testing Examp
- Page 483 and 484:
All-Pairs Combination Testing Examp
- Page 485 and 486:
All-Pairs Combination Testing Examp
- Page 487 and 488:
All-Pairs Combination Testing Examp
- Page 489 and 490:
All-Pairs Combination Testing Examp
- Page 491 and 492:
All-Pairs Combination Testing Examp
- Page 493 and 494:
All-Pairs Combination Testing Examp
- Page 495 and 496:
© Sowmya Padmanabhan, 2003 52
- Page 497 and 498:
Iteration 3: Test case# Y (4) X (3)
- Page 499 and 500:
Iteration 3: Test case# a (4) b (3)
- Page 501 and 502:
Iteration 6: Test case# a (4) b (3)
- Page 503 and 504:
Look In Variable Equivalence classe
- Page 505 and 506:
For ASCII sub-range of allowed grou
- Page 507 and 508:
Files of Type Variable Equivalence
- Page 509 and 510:
Iteration 2 Test case# LI (6) E(4)
- Page 511 and 512:
Appendix J: Day 2 Exercises (Day 2
- Page 513 and 514:
d. Partition the input domain into
- Page 515 and 516:
d. Partition the input domain into
- Page 517:
f. Partition the input domain into
- Page 520:
f. Partition the input domain into
- Page 523:
f. Partition the input domain into
- Page 526:
f. Partition the input domain into
- Page 529 and 530:
d. Next, identify the risks associa
- Page 532:
Non-Numbers Identify the risks asso
- Page 535:
d. Partition the input domain into
- Page 538 and 539:
Day 3 Exercises Date: ____________
- Page 540 and 541:
g. Partition the input domain into
- Page 542 and 543:
e. What is the input domain? f. Nex
- Page 544 and 545:
Enumerated fields 3. In the online
- Page 546 and 547:
. In Internet Explorer, in the File
- Page 548 and 549:
Alignment
- Page 550 and 551:
Border
- Page 552 and 553:
Protection
- Page 555 and 556:
Analyzing given programs/functions
- Page 557 and 558:
3. Is the variable multidimensional
- Page 559 and 560:
iv. Next, identify the risks associ
- Page 561 and 562:
6. For the ‘Insert Table’ funct
- Page 563 and 564:
3. Is the variable multidimensional
- Page 565 and 566:
iv. Next, identify the risks associ
- Page 568 and 569:
Appendix L: Day 4 Exercises (Day 4
- Page 570 and 571:
iv. Determine the number of pairs i
- Page 572 and 573:
v. Build the all-pairs combination
- Page 574 and 575:
4. Develop a series of combination
- Page 576 and 577:
Domain Testing-Test A 1 (100 points
- Page 578 and 579:
3. A string field/variable ‘s’
- Page 580 and 581:
5. The screenshot of the ‘Login
- Page 582 and 583:
7. An I-20 VISA 2 program for inter
- Page 584 and 585:
9. ZLTech has a web-based student r
- Page 586 and 587:
2. A floating-point field/variable
- Page 588 and 589:
4. DVD Collections, Inc. has a shop
- Page 590 and 591:
6. There are four variables ‘a’
- Page 592 and 593:
8. XYZ 3 credit cards offer a ‘ca
- Page 594 and 595:
Appendix N: Performance Test (Perfo
- Page 596 and 597:
Performance Test (Revised) (100 poi
- Page 598 and 599:
Date: _________________ Evaluation
- Page 600 and 601:
Date: _________________ Evaluation
- Page 602 and 603:
Date: _________________ Evaluation
- Page 604 and 605:
Date: _________________ Evaluation
- Page 606 and 607:
Date: _________________ Evaluation
- Page 608 and 609:
Appendix P: Instructional Objective
- Page 610 and 611:
Appendix Q: Bloom’s Taxonomy of L
- Page 612 and 613:
4. Analysis • seeing patterns •
- Page 614 and 615:
Day 2 Examples Day 3 Examples Trace
- Page 616 and 617:
Day 4 Exercises Example Level HOO I
- Page 618 and 619:
Training Schedule Day Instructional
- Page 620 and 621:
STUDENT APPLICATION RESEARCH INVOLV
- Page 622 and 623:
8. Explain how your proposed study
- Page 624 and 625:
CONSENT FORM: DOMAIN TESTING EXPERI
- Page 626 and 627:
Appendix V: Call for Participation:
- Page 628 and 629:
Appendix W: Call for Participation:
- Page 630 and 631:
Appendix X: Performance Tests’ Ev
- Page 632 and 633:
• If one student had provided a g
- Page 634 and 635:
o You could type more or less quick
- Page 636 and 637:
There's no rationale for these test
- Page 638 and 639:
page size, perhaps via print or pri
- Page 640 and 641:
• Using the variables that this s
- Page 642 and 643:
• In the all-pairs analysis, 7 va
- Page 644 and 645:
Analysis of Student Performance in
- Page 646 and 647:
tester with a couple years experien
- Page 648 and 649:
APPENDIX A In this analysis, I used
- Page 650 and 651:
esolution: incrementer buttons: .1
- Page 652 and 653:
A different orientation may be used
- Page 654 and 655:
Slides orientation vs. notes orient
- Page 656 and 657:
localized versions of Windows alter
- Page 658 and 659:
Report on experiment on teaching sp
- Page 660 and 661:
All-pairs analysis The results of t