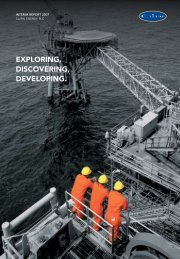
Annual Report 2007 in PDF - Cairn Energy PLC
Annual Report 2007 in PDF - Cairn Energy PLC
Annual Report 2007 in PDF - Cairn Energy PLC

Create successful ePaper yourself
Turn your PDF publications into a flip-book with our unique Google optimized e-Paper software.
DIRECTORS’ REMUNERATION REPORT<br />
CONTINUED<br />
Performance Graphs<br />
Both the FTSE 100 Index and FTSE 250 Index were selected as appropriate comparator <strong>in</strong>dices for the two performance graphs<br />
shown below as although <strong>Cairn</strong> is currently a constituent member of the FTSE 100 Index, it was a constituent member of the<br />
FTSE 250 Index for the majority of <strong>2007</strong>.<br />
The graphs compare <strong>Cairn</strong>’s TSR with that of the chosen <strong>in</strong>dices. The bar chart is presented as additional <strong>in</strong>formation to that<br />
required by the Companies Acts, as amended by the Directors’ Remuneration <strong>Report</strong> Regulations 2002.<br />
Performance Graph – Comparison of five-year cumulative total shareholder return on an <strong>in</strong>vestment of £100<br />
1,200<br />
1,000<br />
200<br />
180<br />
160<br />
140<br />
120<br />
100<br />
80<br />
60<br />
40<br />
20<br />
0<br />
-20<br />
2002 2003 2004 2005 2006 <strong>2007</strong><br />
Performance Graph – Comparison of year on year change <strong>in</strong> the value of an <strong>in</strong>vestment over the past five years<br />
2003 2004 2005 2006 <strong>2007</strong><br />
The market value of one <strong>Cairn</strong> share on 31 December <strong>2007</strong> was £30.74. Dur<strong>in</strong>g <strong>2007</strong>, the range of high and low market value of<br />
shares was £30.90 to £15.23.<br />
CAIRN ENERGY <strong>PLC</strong> ANNUAL REPORT <strong>2007</strong> 65