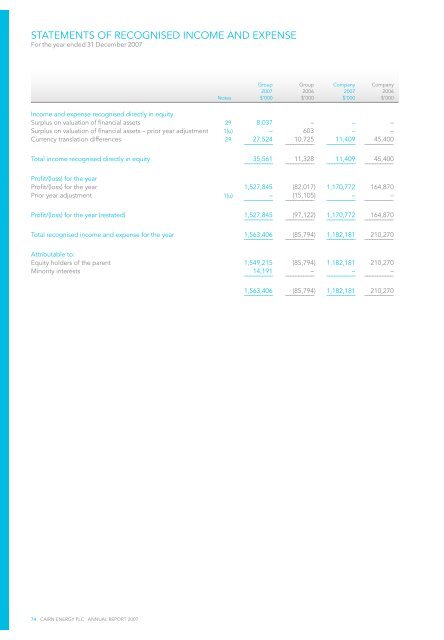
STATEMENTS OF RECOGNISED INCOME AND EXPENSE For the year ended 31 December <strong>2007</strong> 74 CAIRN ENERGY <strong>PLC</strong> ANNUAL REPORT <strong>2007</strong> Group Group Company Company <strong>2007</strong> 2006 <strong>2007</strong> 2006 Notes $’000 $’000 $’000 $’000 Income and expense recognised directly <strong>in</strong> equity Surplus on valuation of f<strong>in</strong>ancial assets 29 8,037 – – – Surplus on valuation of f<strong>in</strong>ancial assets – prior year adjustment 1(u) – 603 – – Currency translation differences 29 27,524 10,725 11,409 45,400 ––––––––––– ––––––––––– ––––––––––– ––––––––––– Total <strong>in</strong>come recognised directly <strong>in</strong> equity 35,561 11,328 11,409 45,400 ––––––––––– ––––––––––– ––––––––––– ––––––––––– Profit/(loss) for the year Profit/(loss) for the year 1,527,845 (82,017) 1,170,772 164,870 Prior year adjustment 1(u) – (15,105) – – ––––––––––– ––––––––––– ––––––––––– ––––––––––– Profit/(loss) for the year (restated) 1,527,845 (97,122) 1,170,772 164,870 ––––––––––– ––––––––––– ––––––––––– ––––––––––– Total recognised <strong>in</strong>come and expense for the year 1,563,406 (85,794) 1,182,181 210,270 ––––––––––– ––––––––––– ––––––––––– ––––––––––– Attributable to: Equity holders of the parent 1,549,215 (85,794) 1,182,181 210,270 M<strong>in</strong>ority <strong>in</strong>terests 14,191 – – – ––––––––––– ––––––––––– ––––––––––– ––––––––––– 1,563,406 (85,794) 1,182,181 210,270 ––––––––––– ––––––––––– ––––––––––– –––––––––––
BALANCE SHEETS As at 31 December <strong>2007</strong> Group Group 2006 Company Company <strong>2007</strong> (Restated) <strong>2007</strong> 2006 Notes $’000 $’000 $’000 $’000 Non-current assets Intangible exploration/appraisal assets 13 607,055 419,239 – – Property, plant & equipment – development/produc<strong>in</strong>g assets 14 498,223 394,010 – – Property, plant & equipment – other 15 6,566 5,891 994 1,291 Intangible assets – other 16 25,276 6,724 5,303 1,730 Available-for-sale f<strong>in</strong>ancial assets 17 15,905 7,868 – – Investments 18 – – 654,551 508,056 ––––––––––– ––––––––––– ––––––––––– ––––––––––– 1,153,025 833,732 660,848 511,077 ––––––––––– ––––––––––– ––––––––––– ––––––––––– Current assets Inventory 19 7,978 4,615 – – Trade and other receivables 20 307,003 218,159 51,661 80,936 Bank deposits 21 30,053 – – – Cash and cash equivalents 21 872,272 856,266 16,591 19,513 Derivative f<strong>in</strong>ancial <strong>in</strong>struments 31 2,479 – – – Income tax assets 7,935 – – – ––––––––––– ––––––––––– ––––––––––– ––––––––––– 1,227,720 1,079,040 68,252 100,449 ––––––––––– ––––––––––– ––––––––––– ––––––––––– Total assets 2,380,745 1,912,772 729,100 611,526 ––––––––––– ––––––––––– ––––––––––– ––––––––––– Current liabilities Trade and other payables 22 273,570 897,232 11,309 113,810 Obligations under f<strong>in</strong>ance leases 24 1,949 1,380 – – Provisions 26 17,766 6,845 – – Derivative f<strong>in</strong>ancial <strong>in</strong>struments 31 – 9,694 – – Income tax liabilities 76 6,064 – – ––––––––––– ––––––––––– ––––––––––– ––––––––––– 293,361 ––––––––––– 921,215 ––––––––––– 11,309 ––––––––––– 113,810 ––––––––––– Non-current liabilities Loans and borrow<strong>in</strong>gs 21, 25 75,000 155,000 – 47,000 Obligations under f<strong>in</strong>ance leases 24 2,431 3,092 – – Provisions 26 40,061 24,740 – – Deferred tax liabilities 23 220,076 ––––––––––– 129,965 ––––––––––– – ––––––––––– – ––––––––––– 337,568 312,797 – 47,000 ––––––––––– ––––––––––– ––––––––––– ––––––––––– Total liabilities 630,929 1,234,012 11,309 160,810 ––––––––––– ––––––––––– ––––––––––– ––––––––––– Net assets 1,749,816 678,760 717,791 450,716 ––––––––––– ––––––––––– ––––––––––– ––––––––––– Equity attributable to equity holders of the parent Called-up share capital 27 15,845 25,870 15,845 25,870 Share premium 28 210,901 201,019 210,901 201,019 Shares held by ESOP Trust 29 (32,019) (55,756) (32,019) (55,756) Foreign currency translation 29 23,996 2,798 45,770 37,181 Capital reserves – non-distributable 29 40,222 40,222 79 79 Reta<strong>in</strong>ed earn<strong>in</strong>gs 29 1,064,148 464,607 477,215 242,323 ––––––––––– ––––––––––– ––––––––––– ––––––––––– 1,323,093 678,760 717,791 450,716 ––––––––––– ––––––––––– ––––––––––– ––––––––––– M<strong>in</strong>ority <strong>in</strong>terests 29 426,723 – – – ––––––––––– ––––––––––– ––––––––––– ––––––––––– Total equity 1,749,816 678,760 717,791 450,716 ––––––––––– ––––––––––– ––––––––––– ––––––––––– CAIRN ENERGY <strong>PLC</strong> ANNUAL REPORT <strong>2007</strong> 75