

Public health successes and missed opportunities
Public-health-successes-and-missed-opportunities-alcohol-mortality-19902014
Public-health-successes-and-missed-opportunities-alcohol-mortality-19902014

Create successful ePaper yourself
Turn your PDF publications into a flip-book with our unique Google optimized e-Paper software.
Regional trends in total adult per capiTA alcohol<br />
consumption<br />
Monitoring alcohol exposure<br />
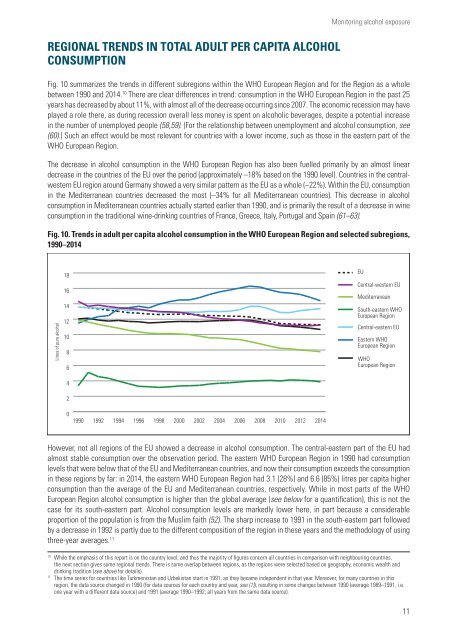
Fig. 10 summarizes the trends in different subregions within the WHO European Region <strong>and</strong> for the Region as a whole<br />
between 1990 <strong>and</strong> 2014. 10 There are clear differences in trend: consumption in the WHO European Region in the past 25<br />
years has decreased by about 11%, with almost all of the decrease occurring since 2007. The economic recession may have<br />
played a role there, as during recession overall less money is spent on alcoholic beverages, despite a potential increase<br />
in the number of unemployed people (58,59). (For the relationship between unemployment <strong>and</strong> alcohol consumption, see<br />
(60).) Such an effect would be most relevant for countries with a lower income, such as those in the eastern part of the<br />
WHO European Region.<br />
The decrease in alcohol consumption in the WHO European Region has also been fuelled primarily by an almost linear<br />
decrease in the countries of the EU over the period (approximately –18% based on the 1990 level). Countries in the centralwestern<br />
EU region around Germany showed a very similar pattern as the EU as a whole (–22%). Within the EU, consumption<br />
in the Mediterranean countries decreased the most (–34% for all Mediterranean countries). This decrease in alcohol<br />
consumption in Mediterranean countries actually started earlier than 1990, <strong>and</strong> is primarily the result of a decrease in wine<br />
consumption in the traditional wine-drinking countries of France, Greece, Italy, Portugal <strong>and</strong> Spain (61–63).<br />
Fig. 10. Trends in adult per capita alcohol consumption in the WHO European Region <strong>and</strong> selected subregions,<br />
1990–2014<br />
Litres of pure alcohol<br />
18<br />
16<br />
14<br />
12<br />
10<br />
8<br />
6<br />
4<br />
2<br />
EU<br />
Central-western EU<br />
Mediterranean<br />
South-eastern WHO<br />
European Region<br />
Central-eastern EU<br />
Eastern WHO<br />
European Region<br />
WHO<br />
European Region<br />
0<br />
1990<br />
1992<br />
1994<br />
1996<br />
1998<br />
2000<br />
2002<br />
2004<br />
2006<br />
2008<br />
2010<br />
2012<br />
2014<br />
However, not all regions of the EU showed a decrease in alcohol consumption. The central-eastern part of the EU had<br />
almost stable consumption over the observation period. The eastern WHO European Region in 1990 had consumption<br />
levels that were below that of the EU <strong>and</strong> Mediterranean countries, <strong>and</strong> now their consumption exceeds the consumption<br />
in these regions by far: in 2014, the eastern WHO European Region had 3.1 (28%) <strong>and</strong> 6.6 (85%) litres per capita higher<br />
consumption than the average of the EU <strong>and</strong> Mediterranean countries, respectively. While in most parts of the WHO<br />
European Region alcohol consumption is higher than the global average (see below for a quantification), this is not the<br />
case for its south-eastern part. Alcohol consumption levels are markedly lower here, in part because a considerable<br />
proportion of the population is from the Muslim faith (52). The sharp increase to 1991 in the south-eastern part followed<br />
by a decrease in 1992 is partly due to the different composition of the region in these years <strong>and</strong> the methodology of using<br />
three-year averages. 11<br />
10<br />
While the emphasis of this report is on the country level, <strong>and</strong> thus the majority of figures concern all countries in comparison with neighbouring countries,<br />
the next section gives some regional trends. There is some overlap between regions, as the regions were selected based on geography, economic wealth <strong>and</strong><br />
drinking tradition (see above for details).<br />
11<br />
The time series for countries like Turkmenistan <strong>and</strong> Uzbekistan start in 1991, as they became independent in that year. Moreover, for many countries in this<br />
region, the data source changed in 1990 (for data sources for each country <strong>and</strong> year, see (1)), resulting in some changes between 1990 (average 1989–1991, i.e.<br />
one year with a different data source) <strong>and</strong> 1991 (average 1990–1992; all years from the same data source).<br />
11

