

Public health successes and missed opportunities
Public-health-successes-and-missed-opportunities-alcohol-mortality-19902014
Public-health-successes-and-missed-opportunities-alcohol-mortality-19902014

Create successful ePaper yourself
Turn your PDF publications into a flip-book with our unique Google optimized e-Paper software.
Burden of alcohol-attributable mortality in the WHO European Region, 1990–2014<br />
Moreover, it is striking that the countries with the highest mortality due to alcohol-attributable injury seem to have a<br />
lesser reduction in mortality rates (see also for regions below) <strong>and</strong>, in some cases, the rates have even increased: for<br />
the WHO European Region, the st<strong>and</strong>ardized mortality rate for all alcohol-attributable injury decreased by 19%, but in<br />
the three countries with the highest such mortality, one had a marked increase (Belarus: +41%), one a slight decrease<br />
(the Russian Federation: –5%) <strong>and</strong> one about the average decrease (Ukraine: –17%). For intentional injury, the overall<br />
decrease was 5%, but in all the three countries, the age-st<strong>and</strong>ardized mortality due to alcohol-attributable intentional<br />
injury increased (Belarus: +61%; the Russian Federation: +10%; Ukraine: +1%). Finally, for unintentional injury, the overall<br />
decrease was –27%, with a 27% increase in Belarus, <strong>and</strong> decreases of 17% <strong>and</strong> 28% in the Russian Federation <strong>and</strong><br />
Ukraine, respectively.<br />
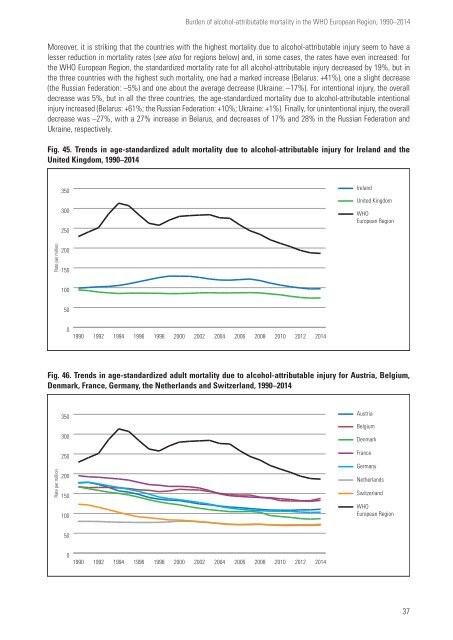
Fig. 45. Trends in age-st<strong>and</strong>ardized adult mortality due to alcohol-attributable injury for Irel<strong>and</strong> <strong>and</strong> the<br />
United Kingdom, 1990–2014<br />
350<br />
300<br />
250<br />
Irel<strong>and</strong><br />
United Kingdom<br />
WHO<br />
European Region<br />
Rate per million<br />
200<br />
150<br />
100<br />
50<br />
0<br />
1990<br />
1992<br />
1994<br />
1996<br />
1998<br />
2000<br />
2002<br />
2004<br />
2006<br />
2008<br />
2010<br />
2012<br />
2014<br />
Fig. 46. Trends in age-st<strong>and</strong>ardized adult mortality due to alcohol-attributable injury for Austria, Belgium,<br />
WHO Euro<br />
Denmark, France, Germany, the Netherl<strong>and</strong>s <strong>and</strong> Switzerl<strong>and</strong>, 1990–2014<br />
United Kingdom<br />
Rate per million<br />
350<br />
300<br />
250<br />
200<br />
150<br />
100<br />
Irel<strong>and</strong><br />
Austria<br />
Belgium<br />
Denmark<br />
France<br />
Germany<br />
Netherl<strong>and</strong>s<br />
Switzerl<strong>and</strong><br />
WHO<br />
European Region<br />
50<br />
0<br />
1990<br />
1992<br />
1994<br />
1996<br />
1998<br />
2000<br />
2002<br />
2004<br />
2006<br />
2008<br />
2010<br />
2012<br />
2014<br />
37

