

Public health successes and missed opportunities
Public-health-successes-and-missed-opportunities-alcohol-mortality-19902014
Public-health-successes-and-missed-opportunities-alcohol-mortality-19902014

Create successful ePaper yourself
Turn your PDF publications into a flip-book with our unique Google optimized e-Paper software.
Burden of alcohol-attributable mortality in the WHO European Region, 1990–2014<br />
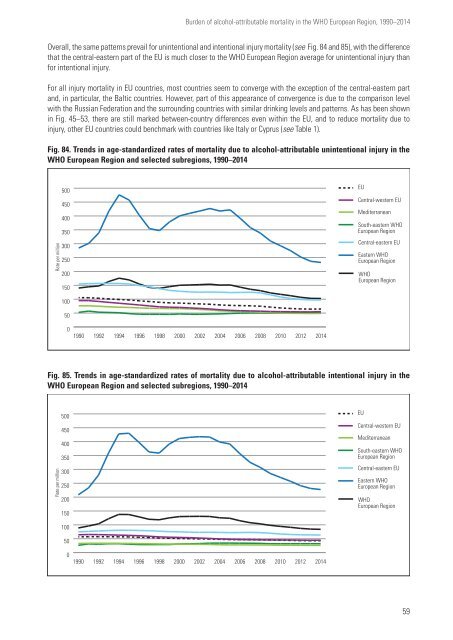
Overall, the same patterns prevail for unintentional <strong>and</strong> intentional injury mortality (see Fig. 84 <strong>and</strong> 85), with the difference<br />
that the central-eastern part of the EU is much closer to the WHO European Region average for unintentional injury than<br />
for intentional injury.<br />
For all injury mortality in EU countries, most countries seem to converge with the exception of the central-eastern part<br />
<strong>and</strong>, in particular, the Baltic countries. However, part of this appearance of convergence is due to the comparison level<br />
with the Russian Federation <strong>and</strong> the surrounding countries with similar drinking levels <strong>and</strong> patterns. As has been shown<br />
in Fig. 45–53, there are still marked between-country differences even within the EU, <strong>and</strong> to reduce mortality due to<br />
injury, other EU countries could benchmark with countries like Italy or Cyprus (see Table 1).<br />
Fig. 84. Trends in age-st<strong>and</strong>ardized rates of mortality due to alcohol-attributable unintentional injury in the<br />
WHO European Region <strong>and</strong> selected subregions, 1990–2014<br />
Rate per million<br />
500<br />
450<br />
400<br />
350<br />
300<br />
250<br />
200<br />
150<br />
EU<br />
Central-western EU<br />
Mediterranean<br />
South-eastern WHO<br />
European Region<br />
Central-eastern EU<br />
Eastern WHO<br />
European Region<br />
WHO<br />
European Region<br />
100<br />
50<br />
0<br />
1990<br />
1992<br />
1994<br />
1996<br />
1998<br />
2000<br />
2002<br />
2004<br />
2006<br />
2008<br />
2010<br />
2012<br />
2014<br />
Fig. 85. Trends in age-st<strong>and</strong>ardized rates of mortality due to alcohol-attributable intentional injury in the<br />
WHO European Region <strong>and</strong> selected subregions, 1990–2014<br />
Rate per million<br />
500<br />
450<br />
400<br />
350<br />
300<br />
250<br />
200<br />
150<br />
EU<br />
Central-western EU<br />
Mediterranean<br />
South-eastern WHO<br />
European Region<br />
Central-eastern EU<br />
Eastern WHO<br />
European Region<br />
WHO<br />
European Region<br />
100<br />
50<br />
0<br />
1990<br />
1992<br />
1994<br />
1996<br />
1998<br />
2000<br />
2002<br />
2004<br />
2006<br />
2008<br />
2010<br />
2012<br />
2014<br />
59

