

Public health successes and missed opportunities
Public-health-successes-and-missed-opportunities-alcohol-mortality-19902014
Public-health-successes-and-missed-opportunities-alcohol-mortality-19902014

You also want an ePaper? Increase the reach of your titles
YUMPU automatically turns print PDFs into web optimized ePapers that Google loves.
Monitoring alcohol exposure<br />
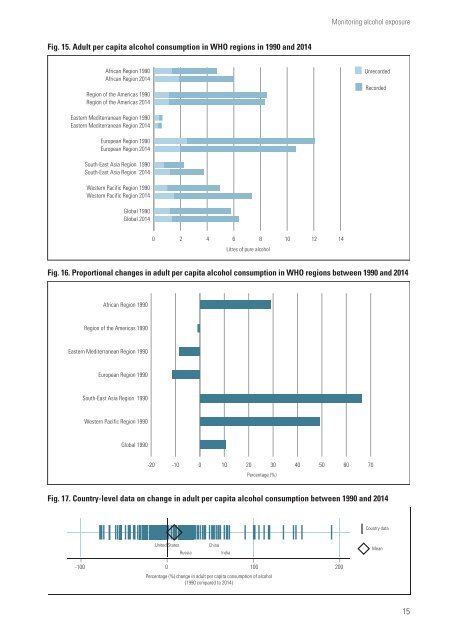
Fig. 15. Adult per capita alcohol consumption in WHO regions in 1990 <strong>and</strong> 2014<br />
African Region 1990<br />
African Region 2014<br />
Region of the Americas 1990<br />
Region of the Americas 2014<br />
Unrecorded<br />
Recorded<br />
Eastern Mediterranean Region 1990<br />
Eastern Mediterranean Region 2014<br />
European Region 1990<br />
European Region 2014<br />
South-East Asia Region 1990<br />
South-East Asia Region 2014<br />
Western Pacific Region 1990<br />
Western Pacific Region 2014<br />
Global 1990<br />
Global 2014<br />
0 2 4 6 8 10 12 14<br />
Litres of pure alcohol<br />
Fig. 16. Proportional changes in adult per capita alcohol consumption in WHO regions between 1990 <strong>and</strong> 2014<br />
African Region 1990<br />
Region of the Americas 1990<br />
Eastern Mediterranean Region 1990<br />
European Region 1990<br />
South-East Asia Region 1990<br />
Western Pacific Region 1990<br />
Global 1990<br />
-20 -10 0 10 20 30 40 50 60 70<br />
Percentage (%)<br />
Fig. 17. Country-level data on change in adult per capita alcohol consumption between 1990 <strong>and</strong> 2014<br />
Unrecorded<br />
O G U T GS<br />
United +;%'*$)"&)-&#V%&'#"7#&%"7%'-)$%'F0%-'GOOLOOOK<br />
States<br />
China<br />
Russia<br />
India<br />
Country data<br />
Mean<br />
-100 0 100 200<br />
Percentage (%) change in adult per capita consumption of alcohol<br />
(1990 compared to 2014)<br />
15

