

Public health successes and missed opportunities
Public-health-successes-and-missed-opportunities-alcohol-mortality-19902014
Public-health-successes-and-missed-opportunities-alcohol-mortality-19902014

You also want an ePaper? Increase the reach of your titles
YUMPU automatically turns print PDFs into web optimized ePapers that Google loves.
Burden of alcohol-attributable mortality in the WHO European Region, 1990–2014<br />
factors along with the use of alcohol, with alcohol also playing a role in the mortality. It should also be noted that the<br />
methodology used for comparative risk assessment did not adequately control for other risk factors.<br />
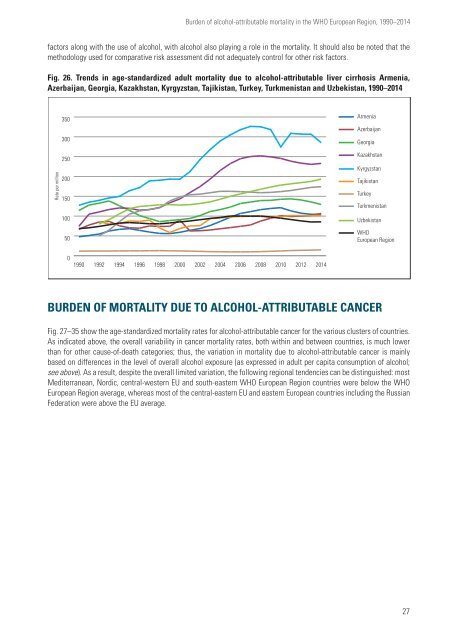
Fig. 26. Trends in age-st<strong>and</strong>ardized adult mortality due to alcohol-attributable liver cirrhosis Armenia,<br />
Azerbaijan, Georgia, Kazakhstan, Kyrgyzstan, Tajikistan, Turkey, Turkmenistan <strong>and</strong> Uzbekistan, 1990–2014<br />
Rate per million<br />
350<br />
300<br />
250<br />
200<br />
150<br />
100<br />
50<br />
Armenia<br />
Azerbaijan<br />
Georgia<br />
Kazakhstan<br />
Kyrgyzstan<br />
Tajikistan<br />
Turkey<br />
Turkmenistan<br />
Uzbekistan<br />
WHO<br />
European Region<br />
0<br />
1990<br />
1992<br />
1994<br />
1996<br />
1998<br />
2000<br />
2002<br />
2004<br />
2006<br />
2008<br />
2010<br />
2012<br />
2014<br />
burden of mortality WHO Euro due to Alcohol-attributable<br />
Turkmenistan<br />
cancer<br />
Tajikistan<br />
Kazakhstan<br />
Fig. 27–35 show the age-st<strong>and</strong>ardized Uzbekistan mortality rates for alcohol-attributable cancer for the various clusters of countries.<br />
Azerbaijan<br />
As indicated above, the overall variability in cancer mortality rates, both within <strong>and</strong> between countries, is much lower<br />
than for other cause-of-death categories; Turkey<br />
Kyrgyzstan<br />
thus, the variation in mortality due to alcohol-attributable cancer is mainly<br />
Armenia<br />
based on differences in the level of overall alcohol exposure (as expressed in adult per capita consumption of alcohol;<br />
see above). As a result, despite the overall limited variation, the following regional tendencies can be distinguished: most<br />
Mediterranean, Nordic, central-western EU <strong>and</strong> south-eastern WHO European Region countries were below the WHO<br />
European Region average, whereas most of the central-eastern EU <strong>and</strong> eastern European countries including the Russian<br />
Federation were above the EU average.<br />
Georgia<br />
27

