

Public health successes and missed opportunities
Public-health-successes-and-missed-opportunities-alcohol-mortality-19902014
Public-health-successes-and-missed-opportunities-alcohol-mortality-19902014

Create successful ePaper yourself
Turn your PDF publications into a flip-book with our unique Google optimized e-Paper software.
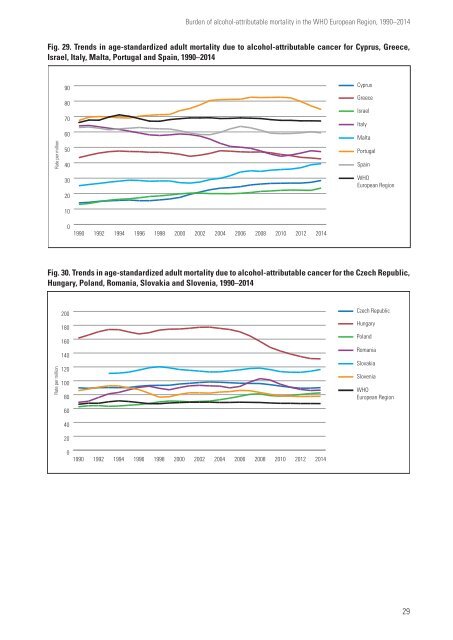
Burden of alcohol-attributable mortality in the WHO European Region, 1990–2014<br />
Fig. 29. Trends in age-st<strong>and</strong>ardized adult mortality due to alcohol-attributable cancer for Cyprus, Greece,<br />
Israel, Italy, Malta, Portugal <strong>and</strong> Spain, 1990–2014<br />
Rate per million<br />
90<br />
80<br />
70<br />
60<br />
50<br />
40<br />
30<br />
20<br />
10<br />
Cyprus<br />
Greece<br />
Israel<br />
Italy<br />
Malta<br />
Portugal<br />
Spain<br />
WHO<br />
European Region<br />
0<br />
1990<br />
1992<br />
1994<br />
1996<br />
1998<br />
2000<br />
2002<br />
2004<br />
2006<br />
2008<br />
2010<br />
2012<br />
2014<br />
Fig. 30. Trends in age-st<strong>and</strong>ardized adult mortality due to alcohol-attributable cancer for the Czech Republic,<br />
Hungary, Pol<strong>and</strong>, Romania, Slovakia <strong>and</strong> Slovenia, 1990–2014<br />
Rate per million<br />
200<br />
180<br />
160<br />
140<br />
120<br />
100<br />
80<br />
Czech Republic<br />
Hungary<br />
Pol<strong>and</strong><br />
Romania<br />
Slovakia<br />
Slovenia<br />
WHO<br />
European Region<br />
60<br />
40<br />
20<br />
0<br />
1990<br />
1992<br />
1994<br />
1996<br />
1998<br />
2000<br />
2002<br />
2004<br />
2006<br />
2008<br />
2010<br />
2012<br />
2014<br />
29

