AT&S World
AT&S World
AT&S World

You also want an ePaper? Increase the reach of your titles
YUMPU automatically turns print PDFs into web optimized ePapers that Google loves.
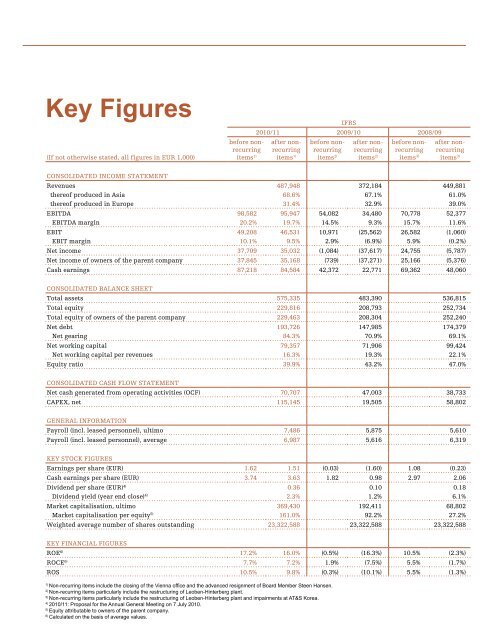
Key Figures IFRS<br />
(If not otherwise stated, all figures in EUR 1,000)<br />
before nonrecurring<br />
items 1)<br />
2010/11 2009/10 2008/09<br />
after nonrecurring<br />
items 1)<br />
before nonrecurring<br />
items 2)<br />
after nonrecurring<br />
items 2)<br />
before nonrecurring<br />
items 3)<br />
after nonrecurring<br />
items 3)<br />
CONSOLIDATED INCOME STATEMENT<br />
Revenues 487,948 372,184 449,881<br />
thereof produced in Asia 68.6% 67.1% 61.0%<br />
thereof produced in Europe 31.4% 32.9% 39.0%<br />
EBITDA 98,582 95,947 54,082 34,480 70,778 52,377<br />
EBITDA margin 20.2% 19.7% 14.5% 9.3% 15.7% 11.6%<br />
EBIT 49,208 46,531 10,971 (25,562) 26,582 (1,060)<br />
EBIT margin 10.1% 9.5% 2.9% (6.9%) 5.9% (0.2%)<br />
Net income 37,709 35,032 (1,084) (37,617) 24,755 (5,787)<br />
Net income of owners of the parent company 37,845 35,168 (739) (37,271) 25,166 (5,376)<br />
Cash earnings 87,218 84,584 42,372 22,771 69,362 48,060<br />
CONSOLIDATED BALANCE SHEET<br />
Total assets 575,335 483,390 536,815<br />
Total equity 229,816 208,793 252,734<br />
Total equity of owners of the parent company 229,463 208,304 252,240<br />
Net debt 193,726 147,985 174,379<br />
Net gearing 84.3% 70.9% 69.1%<br />
Net working capital 79,357 71,906 99,424<br />
Net working capital per revenues 16.3% 19.3% 22.1%<br />
Equity ratio 39.9% 43.2% 47.0%<br />
CONSOLIDATED CASH FLOW STATEMENT<br />
Net cash generated from operating activities (OCF) 70,707 47,003 38,733<br />
CAPEX, net 115,145 19,505 58,802<br />
GENERAL INFORMATION<br />
Payroll (incl. leased personnel), ultimo 7,486 5,875 5,610<br />
Payroll (incl. leased personnel), average 6,987 5,616 6,319<br />
KEY STOCK FIGURES<br />
Earnings per share (EUR) 1.62 1.51 (0.03) (1.60) 1.08 (0.23)<br />
Cash earnings per share (EUR) 3.74 3.63 1.82 0.98 2.97 2.06<br />
Dividend per share (EUR) 4) 0.36 0.10 0.18<br />
Dividend yield (year end close) 4) 2.3% 1.2% 6.1%<br />
Market capitalisation, ultimo 369,430 192,411 68,802<br />
Market capitalisation per equity5) 161.0% 92.2% 27.2%<br />
Weighted average number of shares outstanding 23,322,588 23,322,588 23,322,588<br />
KEY FINANCIAL FIGURES<br />
ROE6) 17.2% 16.0% (0.5%) (16.3%) 10.5% (2.3%)<br />
ROCE6) 7.7% 7.2% 1.9% (7.5%) 5.5% (1.7%)<br />
ROS 10.5% 9.8% (0.3%) (10.1%) 5.5% (1.3%)<br />
1) Non-recurring items include the closing of the Vienna office and the advanced resignment of Board Member Steen Hansen.<br />
2) Non-recurring items particularly include the restructuring of Leoben-Hinterberg plant.<br />
3) Non-recurring items particularly include the restructuring of Leoben-Hinterberg plant and impairments at AT&S Korea.<br />
4) 2010/11: Proposal for the Annual General Meeting on 7 July 2010.<br />
5) Equity attributable to owners of the parent company.<br />
6) Calculated on the basis of average values.