AT&S World
AT&S World
AT&S World

You also want an ePaper? Increase the reach of your titles
YUMPU automatically turns print PDFs into web optimized ePapers that Google loves.
Business Developments<br />
40<br />
Net cash inflows from<br />
operating activities<br />
up 50% year on<br />
year, at EUR 70.7m<br />
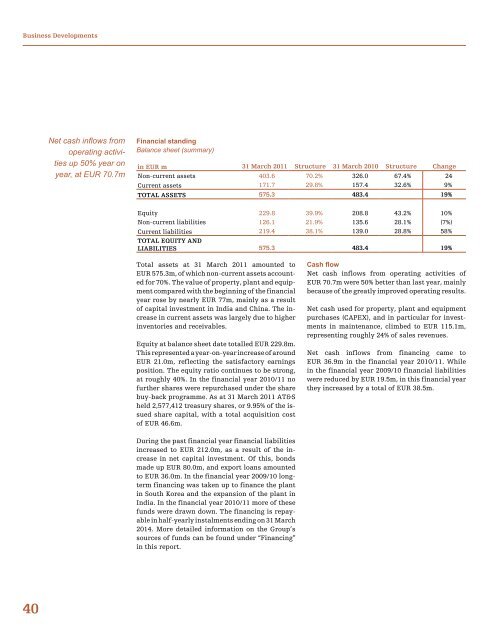
Financial standing<br />
Balance sheet (summary)<br />
in EUR m 31 March 2011 Structure 31 March 2010 Structure Change<br />
Non-current assets 403.6 70.2% 326.0 67.4% 24<br />
Current assets 171.7 29.8% 157.4 32.6% 9%<br />
TOTAL ASSETS 575.3 483.4 19%<br />
Equity 229.8 39.9% 208.8 43.2% 10%<br />
Non-current liabilities 126.1 21.9% 135.6 28.1% (7%)<br />
Current liabilities 219.4 38.1% 139.0 28.8% 58%<br />
TOTAL EQUITY AND<br />
LIABILITIES 575.3 483.4 19%<br />
Total assets at 31 March 2011 amounted to<br />
EUR 575.3m, of which non-current assets accounted<br />
for 70%. The value of property, plant and equipment<br />
compared with the beginning of the financial<br />
year rose by nearly EUR 77m, mainly as a result<br />
of capital investment in India and China. The increase<br />
in current assets was largely due to higher<br />
inventories and receivables.<br />
Equity at balance sheet date totalled EUR 229.8m.<br />
This represented a year-on-year increase of around<br />
EUR 21.0m, reflecting the satisfactory earnings<br />
position. The equity ratio continues to be strong,<br />
at roughly 40%. In the financial year 2010/11 no<br />
further shares were repurchased under the share<br />
buy-back programme. As at 31 March 2011 AT&S<br />
held 2,577,412 treasury shares, or 9.95% of the issued<br />
share capital, with a total acquisition cost<br />
of EUR 46.6m.<br />
During the past financial year financial liabilities<br />
increased to EUR 212.0m, as a result of the increase<br />
in net capital investment. Of this, bonds<br />
made up EUR 80.0m, and export loans amounted<br />
to EUR 36.0m. In the financial year 2009/10 longterm<br />
financing was taken up to finance the plant<br />
in South Korea and the expansion of the plant in<br />
India. In the financial year 2010/11 more of these<br />
funds were drawn down. The financing is repayable<br />
in half-yearly instalments ending on 31 March<br />
2014. More detailed information on the Group’s<br />
sources of funds can be found under “Financing”<br />
in this report.<br />
Cash flow<br />
Net cash inflows from operating activities of<br />
EUR 70.7m were 50% better than last year, mainly<br />
because of the greatly improved operating results.<br />
Net cash used for property, plant and equipment<br />
purchases (CAPEX), and in particular for investments<br />
in maintenance, climbed to EUR 115.1m,<br />
representing roughly 24% of sales revenues.<br />
Net cash inflows from financing came to<br />
EUR 36.9m in the financial year 2010/11. While<br />
in the financial year 2009/10 financial liabilities<br />
were reduced by EUR 19.5m, in this financial year<br />
they increased by a total of EUR 38.5m.