

International Trade Outlook for Latin America and the Caribbean: Recovery in an uncertain context
This first edition of International Trade Outlook for Latin America and the Caribbean, which is the continuation of Latin America and the Caribbean in the World Economy with a new title, covers 2017 and contains three chapters. The first chapter describes the current international context and the recovery of trade in the region. Chapter II reviews the region’s performance in global trade in services in general and in modern services in particular, since 2005. Chapter III provides an overview of Latin America and the Caribbean’s share of the world agricultural trade since 2000 and offers some policy recommendations for increasing the sector’s contribution to regional development.
This first edition of International Trade Outlook for Latin America and the Caribbean, which is the continuation of Latin America and the Caribbean in the World Economy with a new title, covers 2017 and contains three chapters. The first chapter describes the current international context and the recovery of trade in the region. Chapter II reviews the region’s performance in global trade in services in general and in modern services in particular, since 2005. Chapter III provides an overview of Latin America and the Caribbean’s share of the world agricultural trade since 2000 and offers some policy recommendations for increasing the sector’s contribution to regional development.

You also want an ePaper? Increase the reach of your titles
YUMPU automatically turns print PDFs into web optimized ePapers that Google loves.
100 Chapter II<br />
Economic Commission <strong>for</strong> <strong>Lat<strong>in</strong></strong> <strong>America</strong> <strong><strong>an</strong>d</strong> <strong>the</strong> <strong>Caribbe<strong>an</strong></strong> (ECLAC)<br />
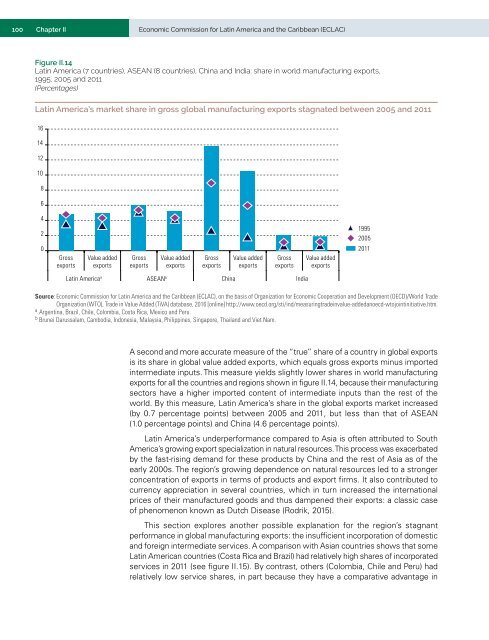
Figure II.14<br />
<strong>Lat<strong>in</strong></strong> <strong>America</strong> (7 countries), ASEAN (8 countries), Ch<strong>in</strong>a <strong><strong>an</strong>d</strong> India: share <strong>in</strong> world m<strong>an</strong>ufactur<strong>in</strong>g exports,<br />
1995, 2005 <strong><strong>an</strong>d</strong> 2011<br />
(Percentages)<br />
<strong>Lat<strong>in</strong></strong> <strong>America</strong>’s market share <strong>in</strong> gross global m<strong>an</strong>ufactur<strong>in</strong>g exports stagnated between 2005 <strong><strong>an</strong>d</strong> 2011<br />
16<br />
14<br />
12<br />
10<br />
8<br />
6<br />
4<br />
2<br />
0<br />
Gross<br />
exports<br />
Value added<br />
exports<br />
Gross<br />
exports<br />
Value added<br />
exports<br />
Gross<br />
exports<br />
Value added<br />
exports<br />
Gross<br />
exports<br />
Value added<br />
exports<br />
1995<br />
2005<br />
2011<br />
<strong>Lat<strong>in</strong></strong> <strong>America</strong> a ASEAN b Ch<strong>in</strong>a India<br />
Source: Economic Commission <strong>for</strong> <strong>Lat<strong>in</strong></strong> <strong>America</strong> <strong><strong>an</strong>d</strong> <strong>the</strong> <strong>Caribbe<strong>an</strong></strong> (ECLAC), on <strong>the</strong> basis of Org<strong>an</strong>ization <strong>for</strong> Economic Cooperation <strong><strong>an</strong>d</strong> Development (OECD)/World <strong>Trade</strong><br />
Org<strong>an</strong>ization (WTO), <strong>Trade</strong> <strong>in</strong> Value Added (TiVA) database, 2016 [onl<strong>in</strong>e] http://www.oecd.org/sti/<strong>in</strong>d/measur<strong>in</strong>gtrade<strong>in</strong>value-added<strong>an</strong>oecd-wtojo<strong>in</strong>t<strong>in</strong>itiative.htm.<br />
a<br />
Argent<strong>in</strong>a, Brazil, Chile, Colombia, Costa Rica, Mexico <strong><strong>an</strong>d</strong> Peru.<br />
b<br />
Brunei Darussalam, Cambodia, Indonesia, Malaysia, Philipp<strong>in</strong>es, S<strong>in</strong>gapore, Thail<strong><strong>an</strong>d</strong> <strong><strong>an</strong>d</strong> Viet Nam.<br />
A second <strong><strong>an</strong>d</strong> more accurate measure of <strong>the</strong> “true” share of a country <strong>in</strong> global exports<br />
is its share <strong>in</strong> global value added exports, which equals gross exports m<strong>in</strong>us imported<br />
<strong>in</strong>termediate <strong>in</strong>puts. This measure yields slightly lower shares <strong>in</strong> world m<strong>an</strong>ufactur<strong>in</strong>g<br />
exports <strong>for</strong> all <strong>the</strong> countries <strong><strong>an</strong>d</strong> regions shown <strong>in</strong> figure II.14, because <strong>the</strong>ir m<strong>an</strong>ufactur<strong>in</strong>g<br />
sectors have a higher imported content of <strong>in</strong>termediate <strong>in</strong>puts th<strong>an</strong> <strong>the</strong> rest of <strong>the</strong><br />
world. By this measure, <strong>Lat<strong>in</strong></strong> <strong>America</strong>’s share <strong>in</strong> <strong>the</strong> global exports market <strong>in</strong>creased<br />
(by 0.7 percentage po<strong>in</strong>ts) between 2005 <strong><strong>an</strong>d</strong> 2011, but less th<strong>an</strong> that of ASEAN<br />
(1.0 percentage po<strong>in</strong>ts) <strong><strong>an</strong>d</strong> Ch<strong>in</strong>a (4.6 percentage po<strong>in</strong>ts).<br />
<strong>Lat<strong>in</strong></strong> <strong>America</strong>’s underper<strong>for</strong>m<strong>an</strong>ce compared to Asia is often attributed to South<br />
<strong>America</strong>’s grow<strong>in</strong>g export specialization <strong>in</strong> natural resources. This process was exacerbated<br />
by <strong>the</strong> fast-ris<strong>in</strong>g dem<strong><strong>an</strong>d</strong> <strong>for</strong> <strong>the</strong>se products by Ch<strong>in</strong>a <strong><strong>an</strong>d</strong> <strong>the</strong> rest of Asia as of <strong>the</strong><br />
early 2000s. The region’s grow<strong>in</strong>g dependence on natural resources led to a stronger<br />
concentration of exports <strong>in</strong> terms of products <strong><strong>an</strong>d</strong> export firms. It also contributed to<br />
currency appreciation <strong>in</strong> several countries, which <strong>in</strong> turn <strong>in</strong>creased <strong>the</strong> <strong>in</strong>ternational<br />
prices of <strong>the</strong>ir m<strong>an</strong>ufactured goods <strong><strong>an</strong>d</strong> thus dampened <strong>the</strong>ir exports: a classic case<br />
of phenomenon known as Dutch Disease (Rodrik, 2015).<br />
This section explores <strong>an</strong>o<strong>the</strong>r possible expl<strong>an</strong>ation <strong>for</strong> <strong>the</strong> region’s stagn<strong>an</strong>t<br />
per<strong>for</strong>m<strong>an</strong>ce <strong>in</strong> global m<strong>an</strong>ufactur<strong>in</strong>g exports: <strong>the</strong> <strong>in</strong>sufficient <strong>in</strong>corporation of domestic<br />
<strong><strong>an</strong>d</strong> <strong>for</strong>eign <strong>in</strong>termediate services. A comparison with Asi<strong>an</strong> countries shows that some<br />
<strong>Lat<strong>in</strong></strong> <strong>America</strong>n countries (Costa Rica <strong><strong>an</strong>d</strong> Brazil) had relatively high shares of <strong>in</strong>corporated<br />
services <strong>in</strong> 2011 (see figure II.15). By contrast, o<strong>the</strong>rs (Colombia, Chile <strong><strong>an</strong>d</strong> Peru) had<br />
relatively low service shares, <strong>in</strong> part because <strong>the</strong>y have a comparative adv<strong>an</strong>tage <strong>in</strong>


