

International Trade Outlook for Latin America and the Caribbean: Recovery in an uncertain context
This first edition of International Trade Outlook for Latin America and the Caribbean, which is the continuation of Latin America and the Caribbean in the World Economy with a new title, covers 2017 and contains three chapters. The first chapter describes the current international context and the recovery of trade in the region. Chapter II reviews the region’s performance in global trade in services in general and in modern services in particular, since 2005. Chapter III provides an overview of Latin America and the Caribbean’s share of the world agricultural trade since 2000 and offers some policy recommendations for increasing the sector’s contribution to regional development.
This first edition of International Trade Outlook for Latin America and the Caribbean, which is the continuation of Latin America and the Caribbean in the World Economy with a new title, covers 2017 and contains three chapters. The first chapter describes the current international context and the recovery of trade in the region. Chapter II reviews the region’s performance in global trade in services in general and in modern services in particular, since 2005. Chapter III provides an overview of Latin America and the Caribbean’s share of the world agricultural trade since 2000 and offers some policy recommendations for increasing the sector’s contribution to regional development.

You also want an ePaper? Increase the reach of your titles
YUMPU automatically turns print PDFs into web optimized ePapers that Google loves.
104 Chapter II<br />
Economic Commission <strong>for</strong> <strong>Lat<strong>in</strong></strong> <strong>America</strong> <strong><strong>an</strong>d</strong> <strong>the</strong> <strong>Caribbe<strong>an</strong></strong> (ECLAC)<br />
highly services-<strong>in</strong>tensive. Both countries have <strong>the</strong> highest shares of both services aimed<br />
at reduc<strong>in</strong>g costs <strong><strong>an</strong>d</strong> those aimed at add<strong>in</strong>g value to m<strong>an</strong>ufactur<strong>in</strong>g exports —“cost<br />
services” <strong><strong>an</strong>d</strong> “value services”, respectively (Arbache, Rouzet <strong><strong>an</strong>d</strong> Sp<strong>in</strong>elli (2016).<br />
Asi<strong>an</strong> countries also show <strong>in</strong>terest<strong>in</strong>g differences. India <strong><strong>an</strong>d</strong> S<strong>in</strong>gapore are <strong>the</strong><br />
countries with <strong>the</strong> highest domestic services value added content of m<strong>an</strong>ufactur<strong>in</strong>g<br />
exports <strong>in</strong> 2011 (almost 20%). While two thirds of this content is concentrated <strong>in</strong><br />
distribution services, <strong>the</strong> bus<strong>in</strong>ess services content of <strong>the</strong>se two countries is also<br />
<strong>the</strong> highest with<strong>in</strong> this region. This probably reflects <strong>the</strong> fact that both countries have<br />
<strong>the</strong> most developed domestic bus<strong>in</strong>ess services sector with<strong>in</strong> <strong>the</strong> Asi<strong>an</strong> sample. The<br />
bus<strong>in</strong>ess services content <strong>in</strong> <strong>the</strong> value of m<strong>an</strong>ufactur<strong>in</strong>g exports <strong>in</strong>creased <strong>in</strong> all countries<br />
between 1995 <strong><strong>an</strong>d</strong> 2011 (except Brunei Darussalam), as regional value cha<strong>in</strong>s —which<br />
require proportionally more of <strong>the</strong>se services— became deeper. F<strong>in</strong><strong>an</strong>cial services<br />
<strong><strong>an</strong>d</strong> real estate are also import<strong>an</strong>t services, particularly <strong>in</strong> India, Thail<strong><strong>an</strong>d</strong> <strong><strong>an</strong>d</strong> Malaysia.<br />
In 2011, <strong>the</strong> imported services content was higher th<strong>an</strong> <strong>the</strong> domestic content <strong>in</strong> all<br />
countries, except <strong>for</strong> India <strong><strong>an</strong>d</strong> <strong>the</strong> Philipp<strong>in</strong>es.<br />
3. Domestic <strong>in</strong>termediate services may contribute<br />
differently to competitiveness th<strong>an</strong> imported ones<br />
<strong>International</strong> r<strong>an</strong>k<strong>in</strong>gs<br />
on <strong>the</strong> quality of<br />
<strong>in</strong>frastructure services<br />
<strong><strong>an</strong>d</strong> ease of access<br />
to lo<strong>an</strong>s show that<br />
several <strong>Lat<strong>in</strong></strong> <strong>America</strong>n<br />
countries per<strong>for</strong>m more<br />
poorly th<strong>an</strong> those<br />
<strong>in</strong> Asia.<br />
Regression results suggest that <strong>the</strong> total domestic services content of m<strong>an</strong>ufactur<strong>in</strong>g<br />
exports is negatively associated with global export market shares, whereas total imported<br />
services content is positively associated. However, some types of domestic bus<strong>in</strong>ess<br />
services seem to contribute positively to ch<strong>an</strong>ges <strong>in</strong> global export market shares,<br />
whereas domestic f<strong>in</strong><strong>an</strong>cial <strong><strong>an</strong>d</strong> real estate services (<strong><strong>an</strong>d</strong> some o<strong>the</strong>r services) seem<br />
negatively associated (see box II.3). The poor quality of certa<strong>in</strong> domestic services may<br />
expla<strong>in</strong> why <strong>the</strong>se reduce <strong>the</strong> competitiveness of <strong>the</strong> region’s m<strong>an</strong>ufactur<strong>in</strong>g goods.<br />
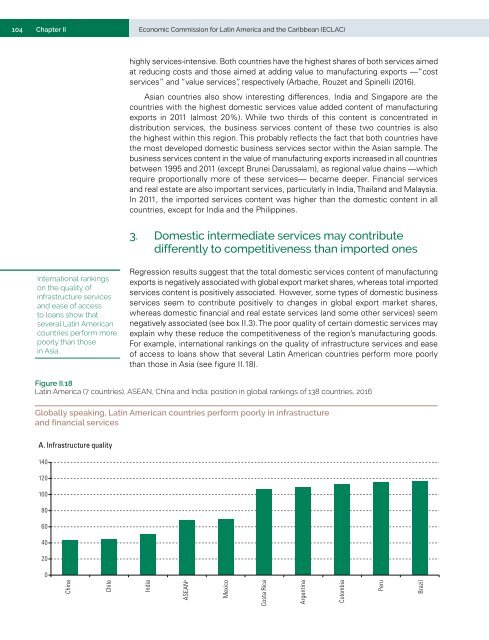
For example, <strong>in</strong>ternational r<strong>an</strong>k<strong>in</strong>gs on <strong>the</strong> quality of <strong>in</strong>frastructure services <strong><strong>an</strong>d</strong> ease<br />
of access to lo<strong>an</strong>s show that several <strong>Lat<strong>in</strong></strong> <strong>America</strong>n countries per<strong>for</strong>m more poorly<br />
th<strong>an</strong> those <strong>in</strong> Asia (see figure II.18).<br />
Figure II.18<br />
<strong>Lat<strong>in</strong></strong> <strong>America</strong> (7 countries), ASEAN, Ch<strong>in</strong>a <strong><strong>an</strong>d</strong> India: position <strong>in</strong> global r<strong>an</strong>k<strong>in</strong>gs of 138 countries, 2016<br />
Globally speak<strong>in</strong>g, <strong>Lat<strong>in</strong></strong> <strong>America</strong>n countries per<strong>for</strong>m poorly <strong>in</strong> <strong>in</strong>frastructure<br />
<strong><strong>an</strong>d</strong> f<strong>in</strong><strong>an</strong>cial services<br />
A. Infrastructure quality<br />
140<br />
120<br />
100<br />
80<br />
60<br />
40<br />
20<br />
0<br />
Ch<strong>in</strong>a<br />
Chile<br />
India<br />
ASEAN a<br />
Mexico<br />
Costa Rica<br />
Argent<strong>in</strong>a<br />
Colombia<br />
Peru<br />
Brazil


