

International Trade Outlook for Latin America and the Caribbean: Recovery in an uncertain context
This first edition of International Trade Outlook for Latin America and the Caribbean, which is the continuation of Latin America and the Caribbean in the World Economy with a new title, covers 2017 and contains three chapters. The first chapter describes the current international context and the recovery of trade in the region. Chapter II reviews the region’s performance in global trade in services in general and in modern services in particular, since 2005. Chapter III provides an overview of Latin America and the Caribbean’s share of the world agricultural trade since 2000 and offers some policy recommendations for increasing the sector’s contribution to regional development.
This first edition of International Trade Outlook for Latin America and the Caribbean, which is the continuation of Latin America and the Caribbean in the World Economy with a new title, covers 2017 and contains three chapters. The first chapter describes the current international context and the recovery of trade in the region. Chapter II reviews the region’s performance in global trade in services in general and in modern services in particular, since 2005. Chapter III provides an overview of Latin America and the Caribbean’s share of the world agricultural trade since 2000 and offers some policy recommendations for increasing the sector’s contribution to regional development.

You also want an ePaper? Increase the reach of your titles
YUMPU automatically turns print PDFs into web optimized ePapers that Google loves.
72 Chapter I<br />
Economic Commission <strong>for</strong> <strong>Lat<strong>in</strong></strong> <strong>America</strong> <strong><strong>an</strong>d</strong> <strong>the</strong> <strong>Caribbe<strong>an</strong></strong> (ECLAC)<br />
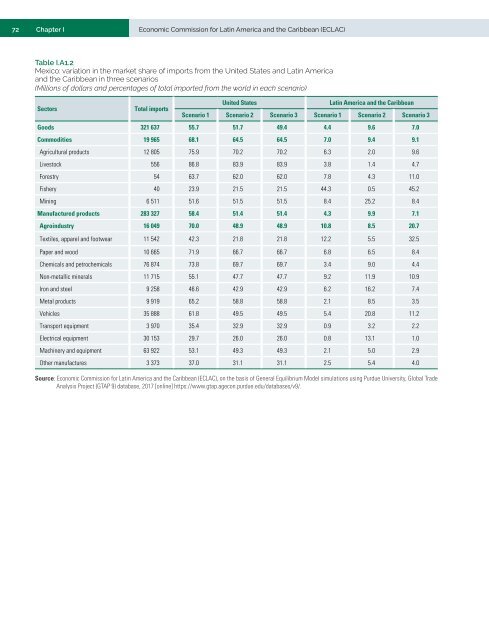
Table I.A1.2<br />
Mexico: variation <strong>in</strong> <strong>the</strong> market share of imports from <strong>the</strong> United States <strong><strong>an</strong>d</strong> <strong>Lat<strong>in</strong></strong> <strong>America</strong><br />
<strong><strong>an</strong>d</strong> <strong>the</strong> <strong>Caribbe<strong>an</strong></strong> <strong>in</strong> three scenarios<br />
(Millions of dollars <strong><strong>an</strong>d</strong> percentages of total imported from <strong>the</strong> world <strong>in</strong> each scenario)<br />
Sectors<br />
Total imports<br />
United States<br />
<strong>Lat<strong>in</strong></strong> <strong>America</strong> <strong><strong>an</strong>d</strong> <strong>the</strong> <strong>Caribbe<strong>an</strong></strong><br />
Scenario 1 Scenario 2 Scenario 3 Scenario 1 Scenario 2 Scenario 3<br />
Goods 321 637 55.7 51.7 49.4 4.4 9.6 7.0<br />
Commodities 19 965 68.1 64.5 64.5 7.0 9.4 9.1<br />
Agricultural products 12 805 75.9 70.2 70.2 6.3 2.0 9.6<br />
Livestock 556 86.8 83.9 83.9 3.8 1.4 4.7<br />
Forestry 54 63.7 62.0 62.0 7.8 4.3 11.0<br />
Fishery 40 23.9 21.5 21.5 44.3 0.5 45.2<br />
M<strong>in</strong><strong>in</strong>g 6 511 51.6 51.5 51.5 8.4 25.2 8.4<br />
M<strong>an</strong>ufactured products 283 327 58.4 51.4 51.4 4.3 9.9 7.1<br />
Agro<strong>in</strong>dustry 16 049 70.0 48.9 48.9 10.8 8.5 20.7<br />
Textiles, apparel <strong><strong>an</strong>d</strong> footwear 11 542 42.3 21.8 21.8 12.2 5.5 32.5<br />
Paper <strong><strong>an</strong>d</strong> wood 10 665 71.9 66.7 66.7 6.8 6.5 8.4<br />
Chemicals <strong><strong>an</strong>d</strong> petrochemicals 76 874 73.8 69.7 69.7 3.4 9.0 4.4<br />
Non-metallic m<strong>in</strong>erals 11 715 55.1 47.7 47.7 9.2 11.9 10.9<br />
Iron <strong><strong>an</strong>d</strong> steel 9 258 46.6 42.9 42.9 6.2 16.2 7.4<br />
Metal products 9 919 65.2 58.8 58.8 2.1 8.5 3.5<br />
Vehicles 35 888 61.8 49.5 49.5 5.4 20.8 11.2<br />
Tr<strong>an</strong>sport equipment 3 970 35.4 32.9 32.9 0.9 3.2 2.2<br />
Electrical equipment 30 153 29.7 26.0 26.0 0.8 13.1 1.0<br />
Mach<strong>in</strong>ery <strong><strong>an</strong>d</strong> equipment 63 922 53.1 49.3 49.3 2.1 5.0 2.9<br />
O<strong>the</strong>r m<strong>an</strong>ufactures 3 373 37.0 31.1 31.1 2.5 5.4 4.0<br />
Source: Economic Commission <strong>for</strong> <strong>Lat<strong>in</strong></strong> <strong>America</strong> <strong><strong>an</strong>d</strong> <strong>the</strong> <strong>Caribbe<strong>an</strong></strong> (ECLAC), on <strong>the</strong> basis of General Equilibrium Model simulations us<strong>in</strong>g Purdue University, Global <strong>Trade</strong><br />
Analysis Project (GTAP 9) database, 2017 [onl<strong>in</strong>e] https://www.gtap.agecon.purdue.edu/databases/v9/.


