

Demographic Change in Toronto's Neighbourhoods

You also want an ePaper? Increase the reach of your titles
YUMPU automatically turns print PDFs into web optimized ePapers that Google loves.
18 | DEMOGRAPHIC CHANGE IN TORONTO’S NEIGHBOURHOODS<br />
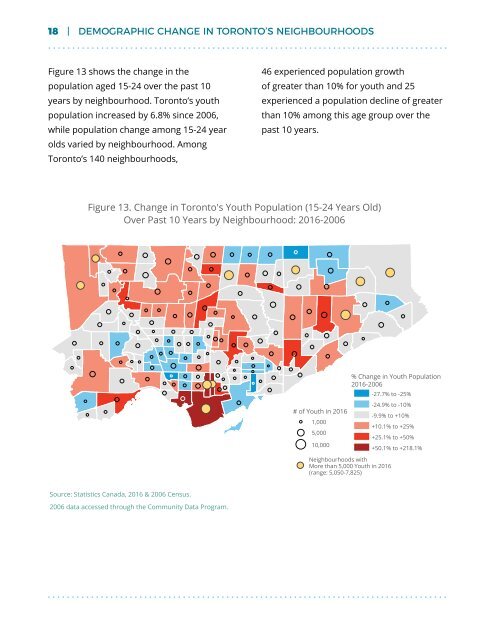
Figure 13 shows the change <strong>in</strong> the<br />
population aged 15-24 over the past 10<br />
years by neighbourhood. Toronto’s youth<br />
population <strong>in</strong>creased by 6.8% s<strong>in</strong>ce 2006,<br />
while population change among 15-24 year<br />
olds varied by neighbourhood. Among<br />
Toronto’s 140 neighbourhoods,<br />
46 experienced population growth<br />
of greater than 10% for youth and 25<br />
experienced a population decl<strong>in</strong>e of greater<br />
than 10% among this age group over the<br />
past 10 years.<br />
Figure 13. <strong>Change</strong> <strong>in</strong> <strong>Toronto's</strong> Youth Population (15-24 Years Old)<br />
Over Past 10 Years by Neighbourhood: 2016-2006<br />
# of Youth <strong>in</strong> 2016<br />
1,000<br />
5,000<br />
10,000<br />
% <strong>Change</strong> <strong>in</strong> Youth Population<br />
2016-2006<br />
-27.7% to -25%<br />
-24.9% to -10%<br />
-9.9% to +10%<br />
+10.1% to +25%<br />
+25.1% to +50%<br />
+50.1% to +218.1%<br />
<strong>Neighbourhoods</strong> with<br />
More than 5,000 Youth <strong>in</strong> 2016<br />
(range: 5,050-7,825)<br />
Source: Statistics Canada, 2016 & 2006 Census.<br />
2006 data accessed through the Community Data Program.


