

Demographic Change in Toronto's Neighbourhoods

You also want an ePaper? Increase the reach of your titles
YUMPU automatically turns print PDFs into web optimized ePapers that Google loves.
24 | DEMOGRAPHIC CHANGE IN TORONTO’S NEIGHBOURHOODS<br />
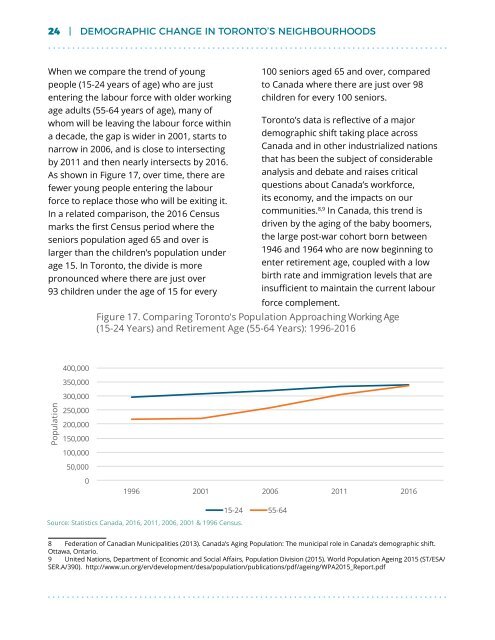
When we compare the trend of young<br />
people (15-24 years of age) who are just<br />
enter<strong>in</strong>g the labour force with older work<strong>in</strong>g<br />
age adults (55-64 years of age), many of<br />
whom will be leav<strong>in</strong>g the labour force with<strong>in</strong><br />
a decade, the gap is wider <strong>in</strong> 2001, starts to<br />
narrow <strong>in</strong> 2006, and is close to <strong>in</strong>tersect<strong>in</strong>g<br />
by 2011 and then nearly <strong>in</strong>tersects by 2016.<br />
As shown <strong>in</strong> Figure 17, over time, there are<br />
fewer young people enter<strong>in</strong>g the labour<br />
force to replace those who will be exit<strong>in</strong>g it.<br />
In a related comparison, the 2016 Census<br />
marks the first Census period where the<br />
seniors population aged 65 and over is<br />
larger than the children’s population under<br />
age 15. In Toronto, the divide is more<br />
pronounced where there are just over<br />
93 children under the age of 15 for every<br />
100 seniors aged 65 and over, compared<br />
to Canada where there are just over 98<br />
children for every 100 seniors.<br />
Toronto’s data is reflective of a major<br />
demographic shift tak<strong>in</strong>g place across<br />
Canada and <strong>in</strong> other <strong>in</strong>dustrialized nations<br />
that has been the subject of considerable<br />
analysis and debate and raises critical<br />
questions about Canada’s workforce,<br />
its economy, and the impacts on our<br />
communities. 8,9 In Canada, this trend is<br />
driven by the ag<strong>in</strong>g of the baby boomers,<br />
the large post-war cohort born between<br />
1946 and 1964 who are now beg<strong>in</strong>n<strong>in</strong>g to<br />
enter retirement age, coupled with a low<br />
birth rate and immigration levels that are<br />
<strong>in</strong>sufficient to ma<strong>in</strong>ta<strong>in</strong> the current labour<br />
force complement.<br />
Figure 17. Compar<strong>in</strong>g <strong>Toronto's</strong> Population Approach<strong>in</strong>g Work<strong>in</strong>g Age<br />
(15-24 Years) and Retirement Age (55-64 Years): 1996-2016<br />
400,000<br />
350,000<br />
300,000<br />
Population<br />
250,000<br />
200,000<br />
150,000<br />
100,000<br />
50,000<br />
0<br />
1996 2001 2006 2011 2016<br />
15-24 55-64<br />
Source: Statistics Canada, 2016, 2011, 2006, 2001 & 1996 Census.<br />
8 Federation of Canadian Municipalities (2013). Canada’s Ag<strong>in</strong>g Population: The municipal role <strong>in</strong> Canada’s demographic shift.<br />
Ottawa, Ontario.<br />
9 United Nations, Department of Economic and Social Affairs, Population Division (2015). World Population Age<strong>in</strong>g 2015 (ST/ESA/<br />
SER.A/390). http://www.un.org/en/development/desa/population/publications/pdf/age<strong>in</strong>g/WPA2015_Report.pdf


