

Demographic Change in Toronto's Neighbourhoods

Create successful ePaper yourself
Turn your PDF publications into a flip-book with our unique Google optimized e-Paper software.
4 | DEMOGRAPHIC CHANGE IN TORONTO’S NEIGHBOURHOODS<br />
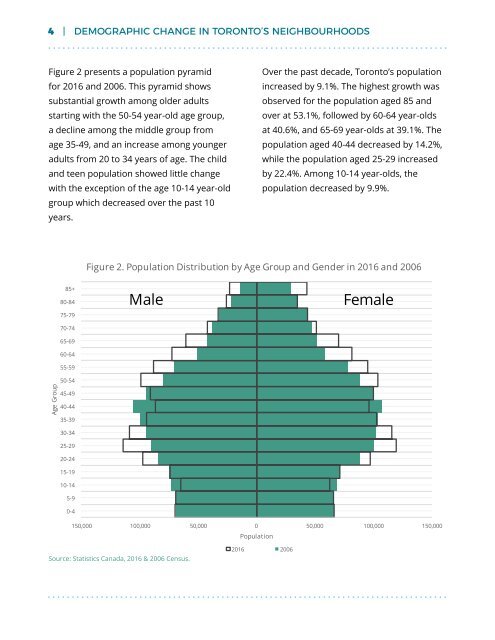
Figure 2 presents a population pyramid<br />
for 2016 and 2006. This pyramid shows<br />
substantial growth among older adults<br />
start<strong>in</strong>g with the 50-54 year-old age group,<br />
a decl<strong>in</strong>e among the middle group from<br />
age 35-49, and an <strong>in</strong>crease among younger<br />
adults from 20 to 34 years of age. The child<br />
and teen population showed little change<br />
with the exception of the age 10-14 year-old<br />
group which decreased over the past 10<br />
years.<br />
Over the past decade, Toronto’s population<br />
<strong>in</strong>creased by 9.1%. The highest growth was<br />
observed for the population aged 85 and<br />
over at 53.1%, followed by 60-64 year-olds<br />
at 40.6%, and 65-69 year-olds at 39.1%. The<br />
population aged 40-44 decreased by 14.2%,<br />
while the population aged 25-29 <strong>in</strong>creased<br />
by 22.4%. Among 10-14 year-olds, the<br />
population decreased by 9.9%.<br />
Figure 2. Population Distribution by Age Group and Gender <strong>in</strong> 2016 and 2006<br />
Age Group<br />
85+<br />
80-84<br />
75-79<br />
70-74<br />
65-69<br />
60-64<br />
55-59<br />
50-54<br />
45-49<br />
40-44<br />
35-39<br />
30-34<br />
25-29<br />
20-24<br />
15-19<br />
10-14<br />
5-9<br />
0-4<br />
Male<br />
Female<br />
150,000 100,000 50,000 0 50,000 100,000 150,000<br />
Population<br />
Source: Statistics Canada, 2016 & 2006 Census.<br />
2016 2006


