

Demographic Change in Toronto's Neighbourhoods

You also want an ePaper? Increase the reach of your titles
YUMPU automatically turns print PDFs into web optimized ePapers that Google loves.
SOCIAL PLANNING TORONTO | 27<br />
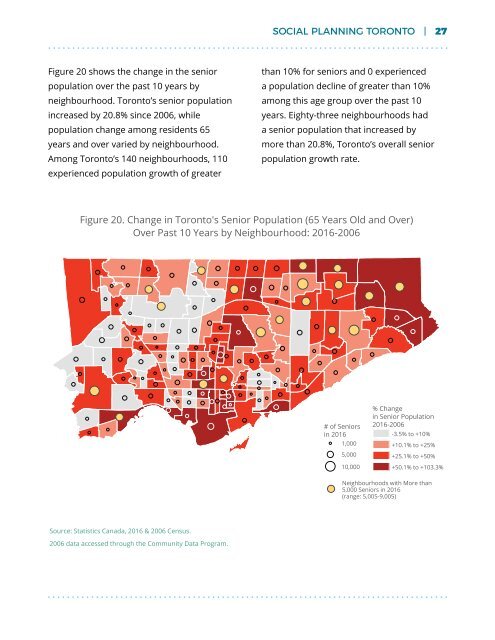
Figure 20 shows the change <strong>in</strong> the senior<br />
population over the past 10 years by<br />
neighbourhood. Toronto’s senior population<br />
<strong>in</strong>creased by 20.8% s<strong>in</strong>ce 2006, while<br />
population change among residents 65<br />
years and over varied by neighbourhood.<br />
Among Toronto’s 140 neighbourhoods, 110<br />
experienced population growth of greater<br />
than 10% for seniors and 0 experienced<br />
a population decl<strong>in</strong>e of greater than 10%<br />
among this age group over the past 10<br />
years. Eighty-three neighbourhoods had<br />
a senior population that <strong>in</strong>creased by<br />
more than 20.8%, Toronto’s overall senior<br />
population growth rate.<br />
Figure 20. <strong>Change</strong> <strong>in</strong> <strong>Toronto's</strong> Senior Population (65 Years Old and Over)<br />
Over Past 10 Years by Neighbourhood: 2016-2006<br />
# of Seniors<br />
<strong>in</strong> 2016<br />
1,000<br />
5,000<br />
10,000<br />
% <strong>Change</strong><br />
<strong>in</strong> Senior Population<br />
2016-2006<br />
-3.5% to +10%<br />
+10.1% to +25%<br />
+25.1% to +50%<br />
+50.1% to +103.3%<br />
<strong>Neighbourhoods</strong> with More than<br />
5,000 Seniors <strong>in</strong> 2016<br />
(range: 5,005-9,005)<br />
Source: Statistics Canada, 2016 & 2006 Census.<br />
2006 data accessed through the Community Data Program.


