

Demographic Change in Toronto's Neighbourhoods

Create successful ePaper yourself
Turn your PDF publications into a flip-book with our unique Google optimized e-Paper software.
22 | DEMOGRAPHIC CHANGE IN TORONTO’S NEIGHBOURHOODS<br />
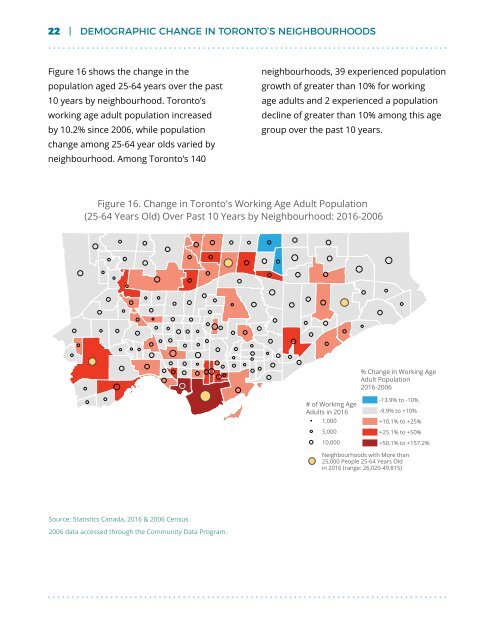
Figure 16 shows the change <strong>in</strong> the<br />
population aged 25-64 years over the past<br />
10 years by neighbourhood. Toronto’s<br />
work<strong>in</strong>g age adult population <strong>in</strong>creased<br />
by 10.2% s<strong>in</strong>ce 2006, while population<br />
change among 25-64 year olds varied by<br />
neighbourhood. Among Toronto’s 140<br />
neighbourhoods, 39 experienced population<br />
growth of greater than 10% for work<strong>in</strong>g<br />
age adults and 2 experienced a population<br />
decl<strong>in</strong>e of greater than 10% among this age<br />
group over the past 10 years.<br />
Figure 16. <strong>Change</strong> <strong>in</strong> <strong>Toronto's</strong> Work<strong>in</strong>g Age Adult Population<br />
(25-64 Years Old) Over Past 10 Years by Neighbourhood: 2016-2006<br />
% <strong>Change</strong> <strong>in</strong> Work<strong>in</strong>g Age<br />
Adult Population<br />
2016-2006<br />
# of Work<strong>in</strong>g Age<br />
Adults <strong>in</strong> 2016<br />
1,000<br />
5,000<br />
10,000<br />
-13.9% to -10%<br />
-9.9% to +10%<br />
+10.1% to +25%<br />
+25.1% to +50%<br />
+50.1% to +157.2%<br />
<strong>Neighbourhoods</strong> with More than<br />
25,000 People 25-64 Years Old<br />
<strong>in</strong> 2016 (range: 26,020-49,815)<br />
Source: Statistics Canada, 2016 & 2006 Census.<br />
2006 data accessed through the Community Data Program.


