

Demographic Change in Toronto's Neighbourhoods

Create successful ePaper yourself
Turn your PDF publications into a flip-book with our unique Google optimized e-Paper software.
28 | DEMOGRAPHIC CHANGE IN TORONTO’S NEIGHBOURHOODS<br />
Waterfront Communities-The Island had<br />
the highest percentage population <strong>in</strong>crease<br />
among seniors at 103.3%, which is much<br />
lower than its overall population growth<br />
of 153.9%. In the Rouge neighbourhood,<br />
the senior population <strong>in</strong>creased by 102.9%<br />
while its overall population growth was<br />
only 8.6%. The Niagara neighbourhood had<br />
population growth among seniors at 88.8%,<br />
a lower rate than its overall population<br />
growth at 116.5%.<br />
Only 6 neighbourhoods experienced a<br />
decrease <strong>in</strong> the population of seniors over<br />
the past 10 years. No neighbourhoods<br />
showed a decl<strong>in</strong>e of more than 3.5%.<br />
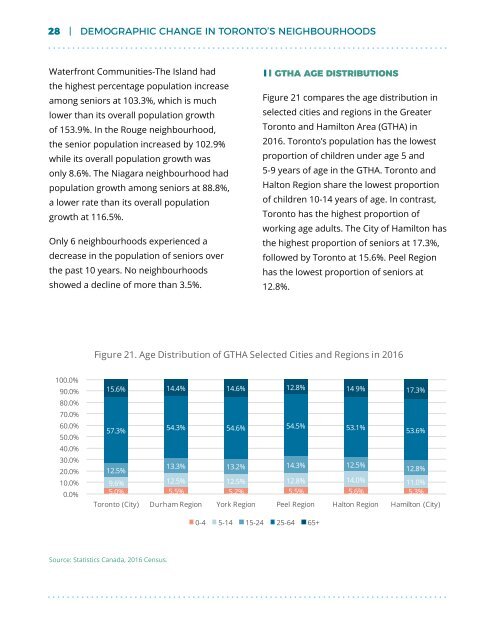
GTHA AGE DISTRIBUTIONS<br />
Figure 21 compares the age distribution <strong>in</strong><br />
selected cities and regions <strong>in</strong> the Greater<br />
Toronto and Hamilton Area (GTHA) <strong>in</strong><br />
2016. Toronto’s population has the lowest<br />
proportion of children under age 5 and<br />
5-9 years of age <strong>in</strong> the GTHA. Toronto and<br />
Halton Region share the lowest proportion<br />
of children 10-14 years of age. In contrast,<br />
Toronto has the highest proportion of<br />
work<strong>in</strong>g age adults. The City of Hamilton has<br />
the highest proportion of seniors at 17.3%,<br />
followed by Toronto at 15.6%. Peel Region<br />
has the lowest proportion of seniors at<br />
12.8%.<br />
Figure 21. Age Distribution of GTHA Selected Cities and Regions <strong>in</strong> 2016<br />
100.0%<br />
90.0%<br />
80.0%<br />
70.0%<br />
60.0%<br />
50.0%<br />
40.0%<br />
30.0%<br />
20.0%<br />
10.0%<br />
0.0%<br />
15.6% 14.4% 14.6% 12.8% 14.9% 17.3%<br />
57.3%<br />
54.3% 54.6% 54.5% 53.1%<br />
53.6%<br />
12.5%<br />
13.3% 13.2% 14.3% 12.5%<br />
12.8%<br />
9.6% 12.5% 12.5% 12.8% 14.0% 11.0%<br />
5.0% 5.5% 5.2% 5.5% 5.6% 5.3%<br />
Toronto (City) Durham Region York Region Peel Region Halton Region Hamilton (City)<br />
0-4 5-14 15-24 25-64 65+<br />
Source: Statistics Canada, 2016 Census.


