

Demographic Change in Toronto's Neighbourhoods

Create successful ePaper yourself
Turn your PDF publications into a flip-book with our unique Google optimized e-Paper software.
30 | DEMOGRAPHIC CHANGE IN TORONTO’S NEIGHBOURHOODS<br />
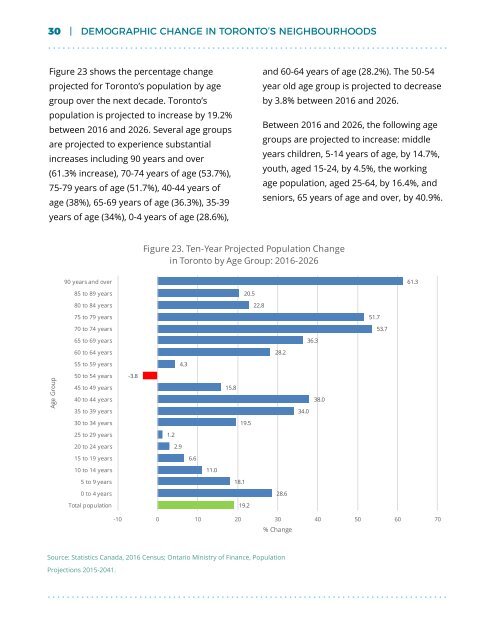
Figure 23 shows the percentage change<br />
projected for Toronto’s population by age<br />
group over the next decade. Toronto’s<br />
population is projected to <strong>in</strong>crease by 19.2%<br />
between 2016 and 2026. Several age groups<br />
are projected to experience substantial<br />
<strong>in</strong>creases <strong>in</strong>clud<strong>in</strong>g 90 years and over<br />
(61.3% <strong>in</strong>crease), 70-74 years of age (53.7%),<br />
75-79 years of age (51.7%), 40-44 years of<br />
age (38%), 65-69 years of age (36.3%), 35-39<br />
years of age (34%), 0-4 years of age (28.6%),<br />
and 60-64 years of age (28.2%). The 50-54<br />
year old age group is projected to decrease<br />
by 3.8% between 2016 and 2026.<br />
Between 2016 and 2026, the follow<strong>in</strong>g age<br />
groups are projected to <strong>in</strong>crease: middle<br />
years children, 5-14 years of age, by 14.7%,<br />
youth, aged 15-24, by 4.5%, the work<strong>in</strong>g<br />
age population, aged 25-64, by 16.4%, and<br />
seniors, 65 years of age and over, by 40.9%.<br />
Figure 23. Ten-Year Projected Population <strong>Change</strong><br />
<strong>in</strong> Toronto by Age Group: 2016-2026<br />
90 years and over<br />
61.3<br />
85 to 89 years<br />
80 to 84 years<br />
20.5<br />
22.8<br />
75 to 79 years<br />
70 to 74 years<br />
51.7<br />
53.7<br />
65 to 69 years<br />
36.3<br />
60 to 64 years<br />
28.2<br />
55 to 59 years<br />
4.3<br />
Age Group<br />
50 to 54 years<br />
45 to 49 years<br />
40 to 44 years<br />
35 to 39 years<br />
-3.8<br />
15.8<br />
34.0<br />
38.0<br />
30 to 34 years<br />
19.5<br />
25 to 29 years<br />
20 to 24 years<br />
1.2<br />
2.9<br />
15 to 19 years<br />
6.6<br />
10 to 14 years<br />
11.0<br />
5 to 9 years<br />
18.1<br />
0 to 4 years<br />
28.6<br />
Total population<br />
19.2<br />
-10 0 10 20 30 40 50 60 70<br />
% <strong>Change</strong><br />
Source: Statistics Canada, 2016 Census; Ontario M<strong>in</strong>istry of F<strong>in</strong>ance, Population<br />
Projections 2015-2041.


