Shaftesbury AR 2017 LR

You also want an ePaper? Increase the reach of your titles
YUMPU automatically turns print PDFs into web optimized ePapers that Google loves.
GOVERNANCE ANNUAL REMUNERATION REPORT <strong>Shaftesbury</strong> Annual Report <strong>2017</strong><br />
3. SH<strong>AR</strong>ESAVE<br />
Options are granted at a 20% discount to the market price on date of grant up to the maximum monthly savings amount permitted by HMRC over three or five years.<br />
NUMBER OF ORDIN<strong>AR</strong>Y SH<strong>AR</strong>ES UNDER OPTION<br />
DATE<br />
OF GRANT<br />
AT<br />
1.10.2016<br />
GRANTED<br />
DURING<br />
YE<strong>AR</strong><br />
LAPSED<br />
DURING<br />
YE<strong>AR</strong><br />
EXERCISED<br />
DURING<br />
YE<strong>AR</strong><br />
AT<br />
30.9.<strong>2017</strong><br />
OPTION<br />
PRICE<br />
£<br />
M<strong>AR</strong>KET VALUE<br />
OF SH<strong>AR</strong>E ON<br />
DATE OF<br />
EXERCISE<br />
£<br />
EXERCISE<br />
PERIOD<br />
B BICKELL 2.7.2014 2,788 - - - 2,788 5.38 - 8.2019-1.2020<br />
1.7.2016 2,024 - - - 2,024 7.41 - 8.2021-1.2022<br />
4,812 - - - 4,812<br />
S J QUAYLE 2.7.2014 2,788 - - - 2,788 5.38 - 8.2019-1.2020<br />
1.7.2016 2,024 - - - 2,024 7.41 - 8.2021-1.2022<br />
4,812 - - - 4,812<br />
T J C WELTON 2.7.2014 2,788 - - - 2,788 5.38 - 8.2019-1.2020<br />
1.7.2016 2,024 - - - 2,024 7.41 - 8.2021-1.2022<br />
4,812 - - - 4,812<br />
C P A W<strong>AR</strong>D 5.7.2012 3,759 - - 3,759 - 3.99 9.81 8.<strong>2017</strong>-1.2018<br />
2.7.2014 2,788 - - - 2,788 5.38 - 8.2019-1.2020<br />
30.6.<strong>2017</strong> - 1,162 - - 1,162 7.74 - 8.2020-1.2021<br />
6,547 1,162 - 3,759 3,950<br />
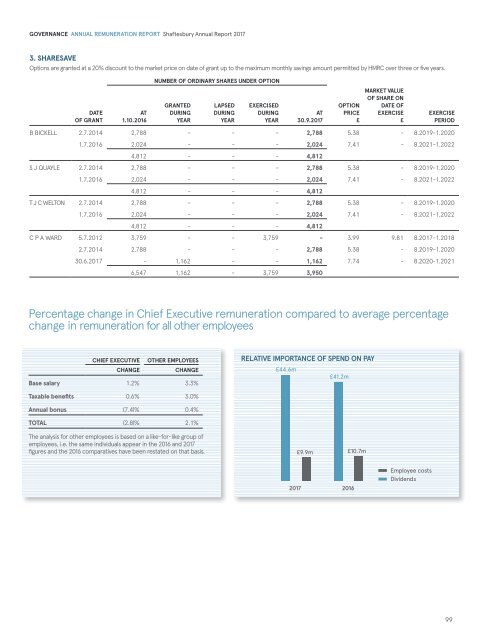
Percentage change in Chief Executive remuneration compared to average percentage<br />
change in remuneration for all other employees<br />
CHIEF EXECUTIVE OTHER EMPLOYEES<br />
CHANGE<br />
CHANGE<br />
Base salary 1.2% 3.3%<br />
RELATIVE IMPORTANCE OF SPEND ON PAY<br />
£44.6m<br />
£41.2m<br />
Taxable benefits 0.6% 3.0%<br />
Annual bonus (7.4)% 0.4%<br />
TOTAL (2.8)% 2.1%<br />
The analysis for other employees is based on a like-for-like group of<br />
employees, i.e. the same individuals appear in the 2016 and <strong>2017</strong><br />
figures and the 2016 comparatives have been restated on that basis.<br />
£9.9m<br />
£10.7m<br />
<strong>2017</strong> 2016<br />
Employee costs<br />
Dividends<br />
99