Shaftesbury AR 2017 LR

You also want an ePaper? Increase the reach of your titles
YUMPU automatically turns print PDFs into web optimized ePapers that Google loves.
STRATEGIC REPORT OVERVIEW HOW WE MEASURE SUCCESS <strong>Shaftesbury</strong> Annual Report <strong>2017</strong><br />
OPERATIONAL MEASURES<br />
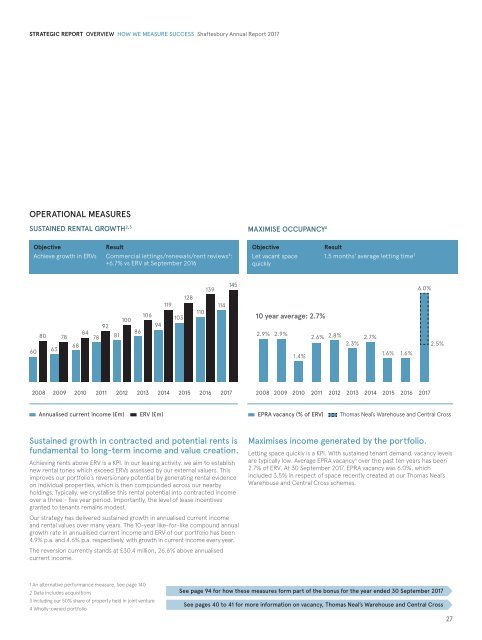
SUSTAINED RENTAL GROWTH 2,3 MAXIMISE OCCUPANCY 4<br />
Objective<br />
Result<br />
Achieve growth in ERVs Commercial lettings/renewals/rent reviews 4 :<br />
+6.7% vs ERV at September 2016<br />
Objective<br />
Let vacant space<br />
quickly<br />
Result<br />
1.5 months' average letting time 3<br />
60<br />
80<br />
63<br />
78<br />
68<br />
84<br />
78<br />
92<br />
81<br />
100<br />
128<br />
119<br />
106<br />
103<br />
94<br />
86<br />
110<br />
139<br />
114<br />
145<br />
10 year average: 2.7%<br />
2.9% 2.9%<br />
2.6% 2.8% 2.3%<br />
1.4%<br />
2.7%<br />
1.6% 1.6%<br />
6.0%<br />
2.5%<br />
2008 2009 2010 2011 2012 2013 2014 2015 2016 <strong>2017</strong><br />
2008 2009 2010 2011 2012 2013 2014 2015 2016 <strong>2017</strong><br />
Annualised current income (£m) ERV (£m) EPRA vacancy (% of ERV) Thomas Neal’s Warehouse and Central Cross<br />
Sustained growth in contracted and potential rents is<br />
fundamental to long-term income and value creation.<br />
Achieving rents above ERV is a KPI. In our leasing activity, we aim to establish<br />
new rental tones which exceed ERVs assessed by our external valuers. This<br />
improves our portfolio’s reversionary potential by generating rental evidence<br />
on individual properties, which is then compounded across our nearby<br />
holdings. Typically, we crystallise this rental potential into contracted income<br />
over a three - five year period. Importantly, the level of lease incentives<br />
granted to tenants remains modest.<br />
Our strategy has delivered sustained growth in annualised current income<br />
and rental values over many years. The 10-year like-for-like compound annual<br />
growth rate in annualised current income and ERV of our portfolio has been<br />
4.9% p.a. and 4.6% p.a. respectively, with growth in current income every year.<br />
The reversion currently stands at £30.4 million, 26.6% above annualised<br />
current income.<br />
Maximises income generated by the portfolio.<br />
Letting space quickly is a KPI. With sustained tenant demand, vacancy levels<br />
are typically low. Average EPRA vacancy 4 over the past ten years has been<br />
2.7% of ERV. At 30 September <strong>2017</strong>, EPRA vacancy was 6.0%, which<br />
included 3.5% in respect of space recently created at our Thomas Neal’s<br />
Warehouse and Central Cross schemes.<br />
1 An alternative performance measure. See page 140<br />
2 Data includes acquisitions<br />
See page 94 for how these measures form part of the bonus for the year ended 30 September <strong>2017</strong><br />
3 Including our 50% share of property held in joint venture<br />
<br />
4 Wholly-owned portfolio<br />
See pages 40 to 41 for more information on vacancy, Thomas Neal’s Warehouse and Central Cross<br />
27