Shaftesbury AR 2017 LR

You also want an ePaper? Increase the reach of your titles
YUMPU automatically turns print PDFs into web optimized ePapers that Google loves.
FINANCIAL STATEMENTS NOTES to the financial statements <strong>Shaftesbury</strong> Annual Report <strong>2017</strong><br />
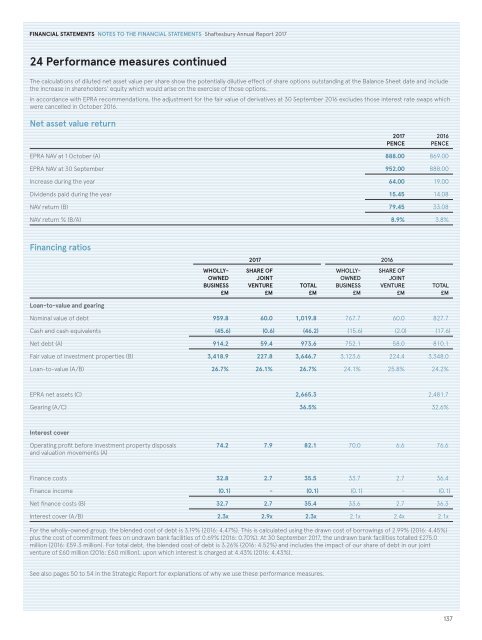
24 Performance measures continued<br />
The calculations of diluted net asset value per share show the potentially dilutive effect of share options outstanding at the Balance Sheet date and include<br />
the increase in shareholders’ equity which would arise on the exercise of those options.<br />
In accordance with EPRA recommendations, the adjustment for the fair value of derivatives at 30 September 2016 excludes those interest rate swaps which<br />
were cancelled in October 2016.<br />
Net asset value return<br />
<strong>2017</strong><br />
PENCE<br />
2016<br />
PENCE<br />
EPRA NAV at 1 October (A) 888.00 869.00<br />
EPRA NAV at 30 September 952.00 888.00<br />
Increase during the year 64.00 19.00<br />
Dividends paid during the year 15.45 14.08<br />
NAV return (B) 79.45 33.08<br />
NAV return % (B/A) 8.9% 3.8%<br />
Financing ratios<br />
<strong>2017</strong> 2016<br />
WHOLLY-<br />
OWNED<br />
BUSINESS<br />
£M<br />
SH<strong>AR</strong>E OF<br />
JOINT<br />
VENTURE<br />
£M<br />
TOTAL<br />
£M<br />
WHOLLY-<br />
OWNED<br />
BUSINESS<br />
£M<br />
SH<strong>AR</strong>E OF<br />
JOINT<br />
VENTURE<br />
£M<br />
TOTAL<br />
£M<br />
Loan-to-value and gearing<br />
Nominal value of debt 959.8 60.0 1,019.8 767.7 60.0 827.7<br />
Cash and cash equivalents (45.6) (0.6) (46.2) (15.6) (2.0) (17.6)<br />
Net debt (A) 914.2 59.4 973.6 752.1 58.0 810.1<br />
Fair value of investment properties (B) 3,418.9 227.8 3,646.7 3,123.6 224.4 3,348.0<br />
Loan-to-value (A/B) 26.7% 26.1% 26.7% 24.1% 25.8% 24.2%<br />
EPRA net assets (C) 2,665.3 2,481.7<br />
Gearing (A/C) 36.5% 32.6%<br />
Interest cover<br />
Operating profit before investment property disposals<br />
and valuation movements (A)<br />
74.2 7.9 82.1 70.0 6.6 76.6<br />
Finance costs 32.8 2.7 35.5 33.7 2.7 36.4<br />
Finance income (0.1) - (0.1) (0.1) - (0.1)<br />
Net finance costs (B) 32.7 2.7 35.4 33.6 2.7 36.3<br />
Interest cover (A/B) 2.3x 2.9x 2.3x 2.1x 2.4x 2.1x<br />
For the wholly-owned group, the blended cost of debt is 3.19% (2016: 4.47%). This is calculated using the drawn cost of borrowings of 2.99% (2016: 4.45%)<br />
plus the cost of commitment fees on undrawn bank facilities of 0.69% (2016: 0.70%). At 30 September <strong>2017</strong>, the undrawn bank facilities totalled £275.0<br />
million (2016: £59.3 million). For total debt, the blended cost of debt is 3.26% (2016: 4.52%) and includes the impact of our share of debt in our joint<br />
venture of £60 million (2016: £60 million), upon which interest is charged at 4.43% (2016: 4.43%).<br />
See also pages 50 to 54 in the Strategic Report for explanations of why we use these performance measures.<br />
137