Shaftesbury AR 2017 LR

You also want an ePaper? Increase the reach of your titles
YUMPU automatically turns print PDFs into web optimized ePapers that Google loves.
STRATEGIC REPORT OTHER INFORMATION <strong>Shaftesbury</strong> Annual Report <strong>2017</strong><br />
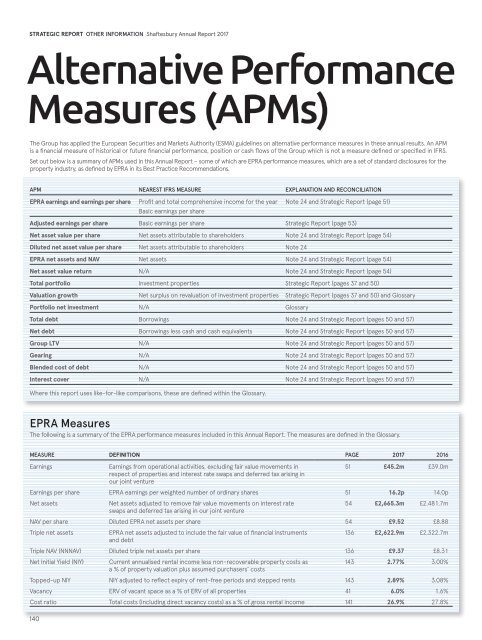
Alternative Performance<br />
Measures (APMs)<br />
The Group has applied the European Securities and Markets Authority (ESMA) guidelines on alternative performance measures in these annual results. An APM<br />
is a financial measure of historical or future financial performance, position or cash flows of the Group which is not a measure defined or specified in IFRS.<br />
Set out below is a summary of APMs used in this Annual Report – some of which are EPRA performance measures, which are a set of standard disclosures for the<br />
property industry, as defined by EPRA in its Best Practice Recommendations.<br />
APM NE<strong>AR</strong>EST IFRS MEASURE EXPLANATION AND RECONCILIATION<br />
EPRA earnings and earnings per share<br />
Profit and total comprehensive income for the year<br />
Basic earnings per share<br />
Note 24 and Strategic Report (page 51)<br />
Adjusted earnings per share Basic earnings per share Strategic Report (page 53)<br />
Net asset value per share Net assets attributable to shareholders Note 24 and Strategic Report (page 54)<br />
Diluted net asset value per share Net assets attributable to shareholders Note 24<br />
EPRA net assets and NAV Net assets Note 24 and Strategic Report (page 54)<br />
Net asset value return N/A Note 24 and Strategic Report (page 54)<br />
Total portfolio Investment properties Strategic Report (pages 37 and 50)<br />
Valuation growth Net surplus on revaluation of investment properties Strategic Report (pages 37 and 50) and Glossary<br />
Portfolio net investment N/A Glossary<br />
Total debt Borrowings Note 24 and Strategic Report (pages 50 and 57)<br />
Net debt Borrowings less cash and cash equivalents Note 24 and Strategic Report (pages 50 and 57)<br />
Group LTV N/A Note 24 and Strategic Report (pages 50 and 57)<br />
Gearing N/A Note 24 and Strategic Report (pages 50 and 57)<br />
Blended cost of debt N/A Note 24 and Strategic Report (pages 50 and 57)<br />
Interest cover N/A Note 24 and Strategic Report (pages 50 and 57)<br />
Where this report uses like-for-like comparisons, these are defined within the Glossary.<br />
EPRA Measures<br />
The following is a summary of the EPRA performance measures included in this Annual Report. The measures are defined in the Glossary.<br />
MEASURE DEFINITION PAGE <strong>2017</strong> 2016<br />
Earnings<br />
140<br />
Earnings from operational activities, excluding fair value movements in<br />
respect of properties and interest rate swaps and deferred tax arising in<br />
our joint venture<br />
51 £45.2m £39.0m<br />
Earnings per share EPRA earnings per weighted number of ordinary shares 51 16.2p 14.0p<br />
Net assets<br />
Net assets adjusted to remove fair value movements on interest rate<br />
swaps and deferred tax arising in our joint venture<br />
54 £2,665.3m £2.481.7m<br />
NAV per share Diluted EPRA net assets per share 54 £9.52 £8.88<br />
Triple net assets<br />
EPRA net assets adjusted to include the fair value of financial instruments<br />
and debt<br />
136 £2,622.9m £2,322.7m<br />
Triple NAV (NNNAV) Diluted triple net assets per share 136 £9.37 £8.31<br />
Net Initial Yield (NIY)<br />
Current annualised rental income less non-recoverable property costs as<br />
a % of property valuation plus assumed purchasers’ costs<br />
143 2.77% 3.00%<br />
Topped-up NIY NIY adjusted to reflect expiry of rent-free periods and stepped rents 143 2.89% 3.08%<br />
Vacancy ERV of vacant space as a % of ERV of all properties 41 6.0% 1.6%<br />
Cost ratio Total costs (including direct vacancy costs) as a % of gross rental income 141 26.9% 27.8%