

African-American Youth in The Juvenile Justice System
African-American Youth in The Juvenile Justice System
African-American Youth in The Juvenile Justice System

Create successful ePaper yourself
Turn your PDF publications into a flip-book with our unique Google optimized e-Paper software.
POLICY BRIEF: RACIAL DISPARITIES IN YOUTH COMMITMENTS AND ARRESTS<br />
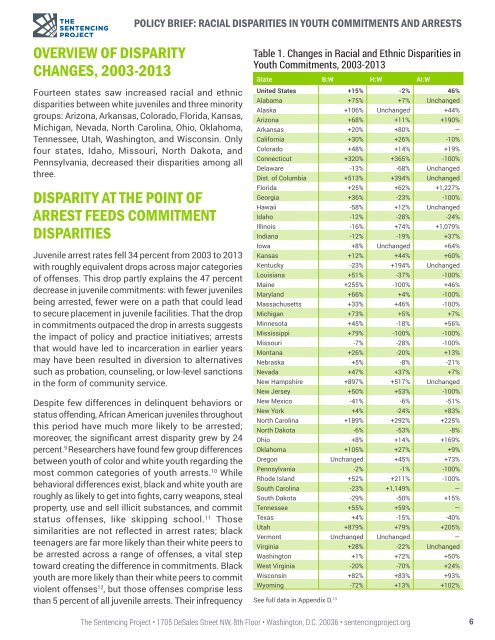
OVERVIEW OF DISPARITY<br />
CHANGES, 2003-2013<br />
Fourteen states saw <strong>in</strong>creased racial and ethnic<br />
disparities between white juveniles and three m<strong>in</strong>ority<br />
groups: Arizona, Arkansas, Colorado, Florida, Kansas,<br />
Michigan, Nevada, North Carol<strong>in</strong>a, Ohio, Oklahoma,<br />
Tennessee, Utah, Wash<strong>in</strong>gton, and Wiscons<strong>in</strong>. Only<br />
four states, Idaho, Missouri, North Dakota, and<br />
Pennsylvania, decreased their disparities among all<br />
three.<br />
DISPARITY AT THE POINT OF<br />
ARREST FEEDS COMMITMENT<br />
DISPARITIES<br />
<strong>Juvenile</strong> arrest rates fell 34 percent from 2003 to 2013<br />
with roughly equivalent drops across major categories<br />
of offenses. This drop partly expla<strong>in</strong>s the 47 percent<br />
decrease <strong>in</strong> juvenile commitments: with fewer juveniles<br />
be<strong>in</strong>g arrested, fewer were on a path that could lead<br />
to secure placement <strong>in</strong> juvenile facilities. That the drop<br />
<strong>in</strong> commitments outpaced the drop <strong>in</strong> arrests suggests<br />
the impact of policy and practice <strong>in</strong>itiatives; arrests<br />
that would have led to <strong>in</strong>carceration <strong>in</strong> earlier years<br />
may have been resulted <strong>in</strong> diversion to alternatives<br />
such as probation, counsel<strong>in</strong>g, or low-level sanctions<br />
<strong>in</strong> the form of community service.<br />
Despite few differences <strong>in</strong> del<strong>in</strong>quent behaviors or<br />
status offend<strong>in</strong>g, <strong>African</strong> <strong>American</strong> juveniles throughout<br />
this period have much more likely to be arrested;<br />
moreover, the significant arrest disparity grew by 24<br />
percent. 9 Researchers have found few group differences<br />
between youth of color and white youth regard<strong>in</strong>g the<br />
most common categories of youth arrests. 10 While<br />
behavioral differences exist, black and white youth are<br />
roughly as likely to get <strong>in</strong>to fights, carry weapons, steal<br />
property, use and sell illicit substances, and commit<br />
status offenses, like skipp<strong>in</strong>g school. 11 Those<br />
similarities are not reflected <strong>in</strong> arrest rates; black<br />
teenagers are far more likely than their white peers to<br />
be arrested across a range of offenses, a vital step<br />
toward creat<strong>in</strong>g the difference <strong>in</strong> commitments. Black<br />
youth are more likely than their white peers to commit<br />
violent offenses 12 , but those offenses comprise less<br />
than 5 percent of all juvenile arrests. <strong>The</strong>ir <strong>in</strong>frequency<br />
Table 1. Changes <strong>in</strong> Racial and Ethnic Disparities <strong>in</strong><br />
<strong>Youth</strong> Commitments, 2003-2013<br />
State B:W H:W AI:W<br />
United States +15% -2% 46%<br />
Alabama +75% +7% Unchanged<br />
Alaska +106% Unchanged +44%<br />
Arizona +68% +11% +190%<br />
Arkansas +20% +80% —<br />
California +30% +26% -10%<br />
Colorado +48% +14% +19%<br />
Connecticut +320% +365% -100%<br />
Delaware -13% -68% Unchanged<br />
Dist. of Columbia +513% +394% Unchanged<br />
Florida +25% +62% +1,227%<br />
Georgia +36% -23% -100%<br />
Hawaii -58% +12% Unchanged<br />
Idaho -12% -28% -24%<br />
Ill<strong>in</strong>ois -16% +74% +1,079%<br />
Indiana -12% -19% +37%<br />
Iowa +8% Unchanged +64%<br />
Kansas +12% +44% +60%<br />
Kentucky -23% +194% Unchanged<br />
Louisiana +51% -37% -100%<br />
Ma<strong>in</strong>e +255% -100% +46%<br />
Maryland +66% +4% -100%<br />
Massachusetts +33% +46% -100%<br />
Michigan +73% +5% +7%<br />
M<strong>in</strong>nesota +45% -18% +56%<br />
Mississippi +79% -100% -100%<br />
Missouri -7% -28% -100%<br />
Montana +26% -20% +13%<br />
Nebraska +5% -8% -21%<br />
Nevada +47% +37% +7%<br />
New Hampshire +897% +517% Unchanged<br />
New Jersey +50% +53% -100%<br />
New Mexico -41% -6% -51%<br />
New York +4% -24% +83%<br />
North Carol<strong>in</strong>a +189% +292% +225%<br />
North Dakota -6% -53% -8%<br />
Ohio +8% +14% +169%<br />
Oklahoma +105% +27% +9%<br />
Oregon Unchanged +45% +73%<br />
Pennsylvania -2% -1% -100%<br />
Rhode Island +52% +211% -100%<br />
South Carol<strong>in</strong>a -23% +1,149% —<br />
South Dakota -29% -50% +15%<br />
Tennessee +55% +59% —<br />
Texas +4% -15% -40%<br />
Utah +879% +79% +205%<br />
Vermont Unchanged Unchanged —<br />
Virg<strong>in</strong>ia +28% -22% Unchanged<br />
Wash<strong>in</strong>gton +1% +72% +50%<br />
West Virg<strong>in</strong>ia -20% -70% +24%<br />
Wiscons<strong>in</strong> +82% +83% +93%<br />
Wyom<strong>in</strong>g -72% +13% +102%<br />
See full data <strong>in</strong> Appendix D. 13<br />
<strong>The</strong> Sentenc<strong>in</strong>g Project • 1705 DeSales Street NW, 8th Floor • Wash<strong>in</strong>gton, D.C. 20036 • sentenc<strong>in</strong>gproject.org<br />
6


