

African-American Youth in The Juvenile Justice System
African-American Youth in The Juvenile Justice System
African-American Youth in The Juvenile Justice System

Create successful ePaper yourself
Turn your PDF publications into a flip-book with our unique Google optimized e-Paper software.
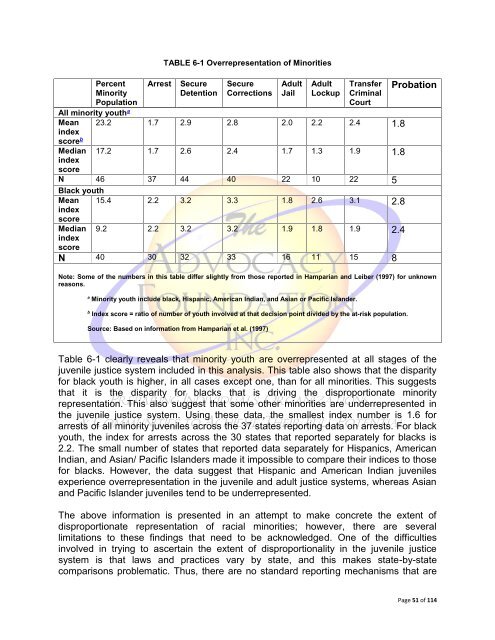
TABLE 6-1 Overrepresentation of M<strong>in</strong>orities<br />
Percent<br />
M<strong>in</strong>ority<br />
Population<br />
Arrest Secure<br />
Detention<br />
Secure<br />
Corrections<br />
Adult<br />
Jail<br />
Adult<br />
Lockup<br />
Transfer<br />
Crim<strong>in</strong>al<br />
Court<br />
All m<strong>in</strong>ority youth a<br />
Mean 23.2 1.7 2.9 2.8 2.0 2.2 2.4<br />
<strong>in</strong>dex<br />
1.8<br />
score b<br />
Median 17.2 1.7 2.6 2.4 1.7 1.3 1.9<br />
<strong>in</strong>dex<br />
1.8<br />
score<br />
N 46 37 44 40 22 10 22 5<br />
Black youth<br />
Mean 15.4 2.2 3.2 3.3 1.8 2.6 3.1<br />
<strong>in</strong>dex<br />
2.8<br />
score<br />
Median 9.2 2.2 3.2 3.2 1.9 1.8 1.9<br />
<strong>in</strong>dex<br />
2.4<br />
score<br />
N 40 30 32 33 16 11 15 8<br />
Probation<br />
Note: Some of the numbers <strong>in</strong> this table differ slightly from those reported <strong>in</strong> Hamparian and Leiber (1997) for unknown<br />
reasons.<br />
a<br />
M<strong>in</strong>ority youth <strong>in</strong>clude black, Hispanic, <strong>American</strong> Indian, and Asian or Pacific Islander.<br />
b<br />
Index score = ratio of number of youth <strong>in</strong>volved at that decision po<strong>in</strong>t divided by the at-risk population.<br />
Source: Based on <strong>in</strong>formation from Hamparian et al. (1997)<br />
Table 6-1 clearly reveals that m<strong>in</strong>ority youth are overrepresented at all stages of the<br />
juvenile justice system <strong>in</strong>cluded <strong>in</strong> this analysis. This table also shows that the disparity<br />
for black youth is higher, <strong>in</strong> all cases except one, than for all m<strong>in</strong>orities. This suggests<br />
that it is the disparity for blacks that is driv<strong>in</strong>g the disproportionate m<strong>in</strong>ority<br />
representation. This also suggest that some other m<strong>in</strong>orities are underrepresented <strong>in</strong><br />
the juvenile justice system. Us<strong>in</strong>g these data, the smallest <strong>in</strong>dex number is 1.6 for<br />
arrests of all m<strong>in</strong>ority juveniles across the 37 states report<strong>in</strong>g data on arrests. For black<br />
youth, the <strong>in</strong>dex for arrests across the 30 states that reported separately for blacks is<br />
2.2. <strong>The</strong> small number of states that reported data separately for Hispanics, <strong>American</strong><br />
Indian, and Asian/ Pacific Islanders made it impossible to compare their <strong>in</strong>dices to those<br />
for blacks. However, the data suggest that Hispanic and <strong>American</strong> Indian juveniles<br />
experience overrepresentation <strong>in</strong> the juvenile and adult justice systems, whereas Asian<br />
and Pacific Islander juveniles tend to be underrepresented.<br />
<strong>The</strong> above <strong>in</strong>formation is presented <strong>in</strong> an attempt to make concrete the extent of<br />
disproportionate representation of racial m<strong>in</strong>orities; however, there are several<br />
limitations to these f<strong>in</strong>d<strong>in</strong>gs that need to be acknowledged. One of the difficulties<br />
<strong>in</strong>volved <strong>in</strong> try<strong>in</strong>g to ascerta<strong>in</strong> the extent of disproportionality <strong>in</strong> the juvenile justice<br />
system is that laws and practices vary by state, and this makes state-by-state<br />
comparisons problematic. Thus, there are no standard report<strong>in</strong>g mechanisms that are<br />
Page 51 of 114


