

African-American Youth in The Juvenile Justice System
African-American Youth in The Juvenile Justice System
African-American Youth in The Juvenile Justice System

Create successful ePaper yourself
Turn your PDF publications into a flip-book with our unique Google optimized e-Paper software.
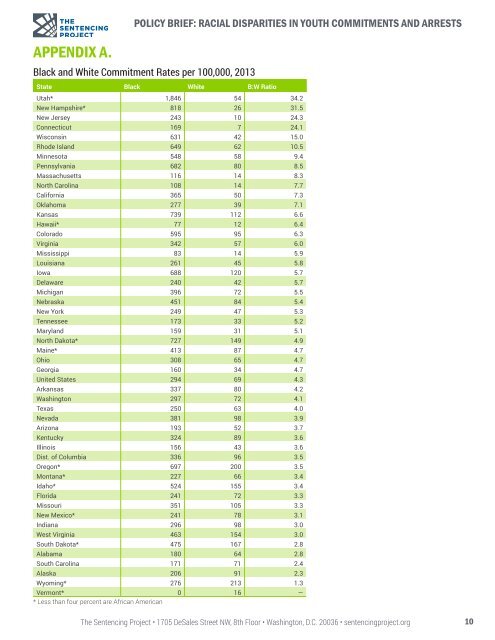
POLICY BRIEF: RACIAL DISPARITIES IN YOUTH COMMITMENTS AND ARRESTS<br />
APPENDIX A.<br />
Black and White Commitment Rates per 100,000, 2013<br />
State Black White B:W Ratio<br />
Utah* 1,846 54 34.2<br />
New Hampshire* 818 26 31.5<br />
New Jersey 243 10 24.3<br />
Connecticut 169 7 24.1<br />
Wiscons<strong>in</strong> 631 42 15.0<br />
Rhode Island 649 62 10.5<br />
M<strong>in</strong>nesota 548 58 9.4<br />
Pennsylvania 682 80 8.5<br />
Massachusetts 116 14 8.3<br />
North Carol<strong>in</strong>a 108 14 7.7<br />
California 365 50 7.3<br />
Oklahoma 277 39 7.1<br />
Kansas 739 112 6.6<br />
Hawaii* 77 12 6.4<br />
Colorado 595 95 6.3<br />
Virg<strong>in</strong>ia 342 57 6.0<br />
Mississippi 83 14 5.9<br />
Louisiana 261 45 5.8<br />
Iowa 688 120 5.7<br />
Delaware 240 42 5.7<br />
Michigan 396 72 5.5<br />
Nebraska 451 84 5.4<br />
New York 249 47 5.3<br />
Tennessee 173 33 5.2<br />
Maryland 159 31 5.1<br />
North Dakota* 727 149 4.9<br />
Ma<strong>in</strong>e* 413 87 4.7<br />
Ohio 308 65 4.7<br />
Georgia 160 34 4.7<br />
United States 294 69 4.3<br />
Arkansas 337 80 4.2<br />
Wash<strong>in</strong>gton 297 72 4.1<br />
Texas 250 63 4.0<br />
Nevada 381 98 3.9<br />
Arizona 193 52 3.7<br />
Kentucky 324 89 3.6<br />
Ill<strong>in</strong>ois 156 43 3.6<br />
Dist. of Columbia 336 96 3.5<br />
Oregon* 697 200 3.5<br />
Montana* 227 66 3.4<br />
Idaho* 524 155 3.4<br />
Florida 241 72 3.3<br />
Missouri 351 105 3.3<br />
New Mexico* 241 78 3.1<br />
Indiana 296 98 3.0<br />
West Virg<strong>in</strong>ia 463 154 3.0<br />
South Dakota* 475 167 2.8<br />
Alabama 180 64 2.8<br />
South Carol<strong>in</strong>a 171 71 2.4<br />
Alaska 206 91 2.3<br />
Wyom<strong>in</strong>g* 276 213 1.3<br />
Vermont* 0 16 —<br />
* Less than four percent are <strong>African</strong> <strong>American</strong><br />
<strong>The</strong> Sentenc<strong>in</strong>g Project • 1705 DeSales Street NW, 8th Floor • Wash<strong>in</strong>gton, D.C. 20036 • sentenc<strong>in</strong>gproject.org<br />
10


