

African-American Youth in The Juvenile Justice System
African-American Youth in The Juvenile Justice System
African-American Youth in The Juvenile Justice System

You also want an ePaper? Increase the reach of your titles
YUMPU automatically turns print PDFs into web optimized ePapers that Google loves.
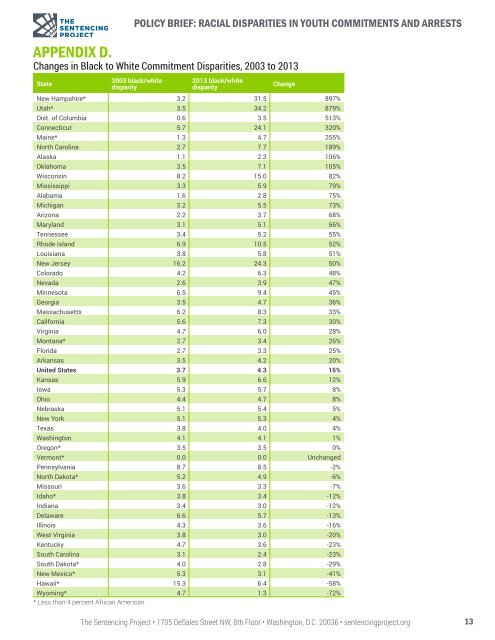
POLICY BRIEF: RACIAL DISPARITIES IN YOUTH COMMITMENTS AND ARRESTS<br />
APPENDIX D.<br />
Changes <strong>in</strong> Black to White Commitment Disparities, 2003 to 2013<br />
State<br />
2003 black/white<br />
disparity<br />
2013 black/white<br />
disparity<br />
Change<br />
New Hampshire* 3.2 31.5 897%<br />
Utah* 3.5 34.2 879%<br />
Dist. of Columbia 0.6 3.5 513%<br />
Connecticut 5.7 24.1 320%<br />
Ma<strong>in</strong>e* 1.3 4.7 255%<br />
North Carol<strong>in</strong>a 2.7 7.7 189%<br />
Alaska 1.1 2.3 106%<br />
Oklahoma 3.5 7.1 105%<br />
Wiscons<strong>in</strong> 8.2 15.0 82%<br />
Mississippi 3.3 5.9 79%<br />
Alabama 1.6 2.8 75%<br />
Michigan 3.2 5.5 73%<br />
Arizona 2.2 3.7 68%<br />
Maryland 3.1 5.1 66%<br />
Tennessee 3.4 5.2 55%<br />
Rhode Island 6.9 10.5 52%<br />
Louisiana 3.8 5.8 51%<br />
New Jersey 16.2 24.3 50%<br />
Colorado 4.2 6.3 48%<br />
Nevada 2.6 3.9 47%<br />
M<strong>in</strong>nesota 6.5 9.4 45%<br />
Georgia 3.5 4.7 36%<br />
Massachusetts 6.2 8.3 33%<br />
California 5.6 7.3 30%<br />
Virg<strong>in</strong>ia 4.7 6.0 28%<br />
Montana* 2.7 3.4 26%<br />
Florida 2.7 3.3 25%<br />
Arkansas 3.5 4.2 20%<br />
United States 3.7 4.3 15%<br />
Kansas 5.9 6.6 12%<br />
Iowa 5.3 5.7 8%<br />
Ohio 4.4 4.7 8%<br />
Nebraska 5.1 5.4 5%<br />
New York 5.1 5.3 4%<br />
Texas 3.8 4.0 4%<br />
Wash<strong>in</strong>gton 4.1 4.1 1%<br />
Oregon* 3.5 3.5 0%<br />
Vermont* 0.0 0.0 Unchanged<br />
Pennsylvania 8.7 8.5 -2%<br />
North Dakota* 5.2 4.9 -6%<br />
Missouri 3.6 3.3 -7%<br />
Idaho* 3.8 3.4 -12%<br />
Indiana 3.4 3.0 -12%<br />
Delaware 6.6 5.7 -13%<br />
Ill<strong>in</strong>ois 4.3 3.6 -16%<br />
West Virg<strong>in</strong>ia 3.8 3.0 -20%<br />
Kentucky 4.7 3.6 -23%<br />
South Carol<strong>in</strong>a 3.1 2.4 -23%<br />
South Dakota* 4.0 2.8 -29%<br />
New Mexico* 5.3 3.1 -41%<br />
Hawaii* 15.3 6.4 -58%<br />
Wyom<strong>in</strong>g* 4.7 1.3 -72%<br />
* Less than 4 percent <strong>African</strong> <strong>American</strong>.<br />
<strong>The</strong> Sentenc<strong>in</strong>g Project • 1705 DeSales Street NW, 8th Floor • Wash<strong>in</strong>gton, D.C. 20036 • sentenc<strong>in</strong>gproject.org<br />
13


