Registration Document - Pernod Ricard
Registration Document - Pernod Ricard
Registration Document - Pernod Ricard

Create successful ePaper yourself
Turn your PDF publications into a flip-book with our unique Google optimized e-Paper software.
3 Key<br />
38<br />
MANAGEMENT REPORT<br />
fi gures from the consolidated fi nancial statements for the year ended 30 June 2009<br />
Key figures from the consolidated<br />
financial statements for the year<br />
ended 30 June 2009<br />
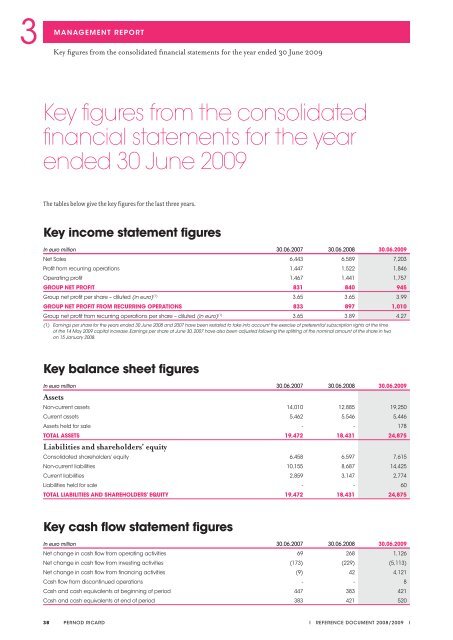
The tables below give the key figures for the last three years.<br />
Key income statement figures<br />
In euro million 30.06.2007 30.06.2008 30.06.2009<br />
Net Sales 6,443 6,589 7,203<br />
Profit from recurring operations 1,447 1,522 1,846<br />
Operating profit 1,467 1,441 1,757<br />
GROUP NET PROFIT 831 840 945<br />
Group net profit per share – diluted (in euro) (1) 3.65 3.65 3.99<br />
GROUP NET PROFIT FROM RECURRING OPERATIONS 833 897 1,010<br />
Group net profit from recurring operations per share – diluted (in euro) (1) 3.65 3.89 4.27<br />
(1) Earnings per share for the years ended 30 June 2008 and 2007 have been restated to take into account the exercise of preferential subscription rights at the time<br />
of the 14 May 2009 capital increase. Earnings per share at June 30, 2007 have also been adjusted following the splitting of the nominal amount of the share in two<br />
on 15 January 2008.<br />
Key balance sheet figures<br />
In euro million<br />
Assets<br />
30.06.2007 30.06.2008 30.06.2009<br />
Non-current assets 14,010 12,885 19,250<br />
Current assets 5,462 5,546 5,446<br />
Assets held for sale - - 178<br />
TOTAL ASSETS 19,472 18,431 24,875<br />
Liabilities and shareholders’ equity<br />
Consolidated shareholders’ equity 6,458 6,597 7,615<br />
Non-current liabilities 10,155 8,687 14,425<br />
Current liabilities 2,859 3,147 2,774<br />
Liabilities held for sale - - 60<br />
TOTAL LIABILITIES AND SHAREHOLDERS’ EQUITY 19,472 18,431 24,875<br />
Key cash flow statement figures<br />
In euro million 30.06.2007 30.06.2008 30.06.2009<br />
Net change in cash flow from operating activities 69 268 1,126<br />
Net change in cash flow from investing activities (173) (229) (5,113)<br />
Net change in cash flow from financing activities (9) 42 4,121<br />
Cash flow from discontinued operations - - 8<br />
Cash and cash equivalents at beginning of period 447 383 421<br />
Cash and cash equivalents at end of period 383 421 520<br />
PERNOD RICARD<br />
I REFERENCE DOCUMENT 2008/2009 I