3990 Learning at home workbook 6 ebook
You also want an ePaper? Increase the reach of your titles
YUMPU automatically turns print PDFs into web optimized ePapers that Google loves.
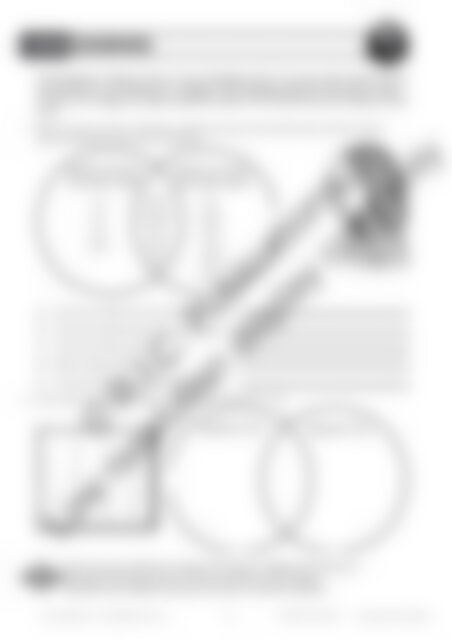
VENN DIAGRAMS<br />
A Venn diagram is made up of two or more overlapping circles. It is used to show results of two or<br />
more different sets of inform<strong>at</strong>ion or c<strong>at</strong>egories. The overlapping shows the d<strong>at</strong>a which could be<br />
in either set or c<strong>at</strong>egory. The space around the outside is for the d<strong>at</strong>a th<strong>at</strong> do not belong in either<br />
circle.<br />
1. Bianca surveyed a group of classm<strong>at</strong>es regarding who spent their pocket money and who saved it.<br />
Look <strong>at</strong> the diagram and answer the questions.<br />
(a)<br />
(b)<br />
(c)<br />
(d)<br />
(e)<br />
How many students save their pocket money?<br />
How many students spend their pocket money?<br />
How many students do both?<br />
Which c<strong>at</strong>egory did Emily choose?<br />
How many students were surveyed altogether?<br />
2. Use the Venn diagram below to sort the counting numbers from 1-20.<br />
1 2 3 4<br />
5 6 7 8<br />
9 10 11 12<br />
© R.I.C. Public<strong>at</strong>ions<br />
Low resolution display copy only<br />
13 14 15 16<br />
17 18 19 20<br />
Survey your class about their favourite TV programs. C<strong>at</strong>egorise the shows into<br />
(a) sitcom (b) cartoon (c) movie. Show the results as a Venn diagram.<br />
Remember, some students may have more than one favourite program.<br />
R.I.C. Public<strong>at</strong>ions® www.ricpublic<strong>at</strong>ions.com.au 109 ISBN 978-1-922313-88-1 <strong>Learning</strong> <strong>at</strong> <strong>home</strong> <strong>workbook</strong> 6


