3990 Learning at home workbook 6 ebook

You also want an ePaper? Increase the reach of your titles
YUMPU automatically turns print PDFs into web optimized ePapers that Google loves.
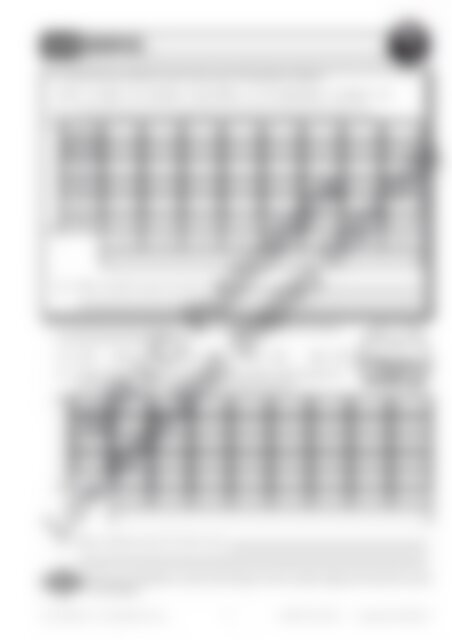
BAR GRAPHS<br />
1. A local bike shop recorded its sales for the month of September as follows:<br />
trikes – 12, bikes – 22, 16 ll bikes – 36, 20 ll bikes – 15, 12” adult bikes – 5, scooters – 18<br />
(a)<br />
Record the sales on the bar graph below and label the horizontal and vertical axes.<br />
(b)<br />
Make a st<strong>at</strong>ement about the above result.<br />
2. The local travel agent coll<strong>at</strong>ed its customers’ methods of travel for the previous<br />
year and found the following results:<br />
car – 325 plane – 789 bus – 453 train – 148 ship – 276<br />
(a)<br />
Display this inform<strong>at</strong>ion in a bar graph below. Include a heading, labels for<br />
both axes and an appropri<strong>at</strong>e scale for the number of people.<br />
© R.I.C. Public<strong>at</strong>ions<br />
Low resolution display copy only<br />
(b) Make a st<strong>at</strong>ement about the above result.<br />
Survey your classm<strong>at</strong>es on wh<strong>at</strong> time they go to bed on school nights and record the results<br />
in a bar graph.<br />
R.I.C. Public<strong>at</strong>ions® www.ricpublic<strong>at</strong>ions.com.au 53 ISBN 978-1-922313-88-1 <strong>Learning</strong> <strong>at</strong> <strong>home</strong> <strong>workbook</strong> 6