

Review of Maritime Transport 2010 - Unctad
Review of Maritime Transport 2010 - Unctad
Review of Maritime Transport 2010 - Unctad

Create successful ePaper yourself
Turn your PDF publications into a flip-book with our unique Google optimized e-Paper software.
CHapteR 4: fReigHt Rates 89<br />
2009 proved to be an extremely difficult year for<br />
container freight rates. Individual carriers attempted<br />
to “talk up” freight rates by publishing in the press<br />
numerous notices <strong>of</strong> rate increases. Once a notice<br />
had been issued by one carrier, other carriers<br />
followed suit. These notices did not prevent shippers<br />
from bargaining hard, and the average freight rates<br />
received by APL and OOCL in the second quarter<br />
<strong>of</strong> 2009 were down by 29 per cent compared to the<br />
same period in 2008.<br />
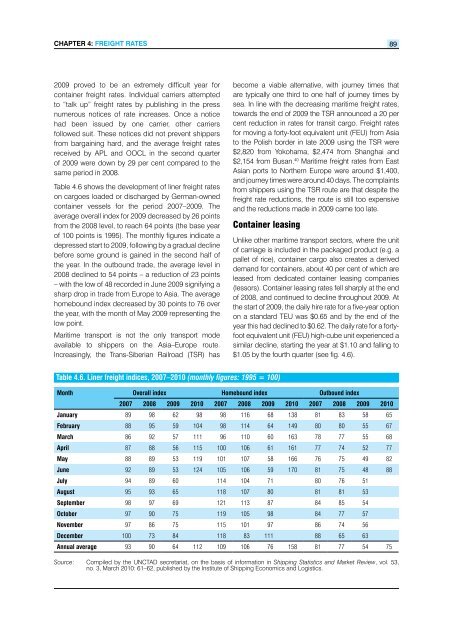
Table 4.6 shows the development <strong>of</strong> liner freight rates<br />
on cargoes loaded or discharged by German-owned<br />
container vessels for the period 2007–2009. The<br />
average overall index for 2009 decreased by 26 points<br />
from the 2008 level, to reach 64 points (the base year<br />
<strong>of</strong> 100 points is 1995). The monthly figures indicate a<br />
depressed start to 2009, following by a gradual decline<br />
before some ground is gained in the second half <strong>of</strong><br />
the year. In the outbound trade, the average level in<br />
2008 declined to 54 points – a reduction <strong>of</strong> 23 points<br />
– with the low <strong>of</strong> 48 recorded in June 2009 signifying a<br />
sharp drop in trade from Europe to Asia. The average<br />
homebound index decreased by 30 points to 76 over<br />
the year, with the month <strong>of</strong> May 2009 representing the<br />
low point.<br />
<strong>Maritime</strong> transport is not the only transport mode<br />
available to shippers on the Asia–Europe route.<br />
Increasingly, the Trans-Siberian Railroad (TSR) has<br />
become a viable alternative, with journey times that<br />
are typically one third to one half <strong>of</strong> journey times by<br />
sea. In line with the decreasing maritime freight rates,<br />
towards the end <strong>of</strong> 2009 the TSR announced a 20 per<br />
cent reduction in rates for transit cargo. Freight rates<br />
for moving a forty-foot equivalent unit (FEU) from Asia<br />
to the Polish border in late 2009 using the TSR were<br />
$2,820 from Yokohama, $2,474 from Shanghai and<br />
$2,154 from Busan. 40 <strong>Maritime</strong> freight rates from East<br />
Asian ports to Northern Europe were around $1,400,<br />
and journey times were around 40 days. The complaints<br />
from shippers using the TSR route are that despite the<br />
freight rate reductions, the route is still too expensive<br />
and the reductions made in 2009 came too late.<br />
container leasing<br />
Table 4.6. Liner freight indices, 2007–<strong>2010</strong> (monthly figures: 1995 = 100)<br />
Unlike other maritime transport sectors, where the unit<br />
<strong>of</strong> carriage is included in the packaged product (e.g. a<br />
pallet <strong>of</strong> rice), container cargo also creates a derived<br />
demand for containers, about 40 per cent <strong>of</strong> which are<br />
leased from dedicated container leasing companies<br />
(lessors). Container leasing rates fell sharply at the end<br />
<strong>of</strong> 2008, and continued to decline throughout 2009. At<br />
the start <strong>of</strong> 2009, the daily hire rate for a five-year option<br />
on a standard TEU was $0.65 and by the end <strong>of</strong> the<br />
year this had declined to $0.62. The daily rate for a fortyfoot<br />
equivalent unit (FEU) high-cube unit experienced a<br />
similar decline, starting the year at $1.10 and falling to<br />
$1.05 by the fourth quarter (see fig. 4.6).<br />
Month Overall index Homebound index Outbound index<br />
2007 2008 2009 <strong>2010</strong> 2007 2008 2009 <strong>2010</strong> 2007 2008 2009 <strong>2010</strong><br />
January 89 98 62 98 98 116 68 138 81 83 58 65<br />
February 88 95 59 104 98 114 64 149 80 80 55 67<br />
March 86 92 57 111 96 110 60 163 78 77 55 68<br />
April 87 88 56 115 100 106 61 161 77 74 52 77<br />
May 88 89 53 119 101 107 58 166 76 75 49 82<br />
June 92 89 53 124 105 106 59 170 81 75 48 88<br />
July 94 89 60 114 104 71 80 76 51<br />
August 95 93 65 118 107 80 81 81 53<br />
September 98 97 69 121 113 87 84 85 54<br />
October 97 90 75 119 105 98 84 77 57<br />
November 97 86 75 115 101 97 86 74 56<br />
December 100 73 84 118 83 111 88 65 63<br />
Annual average 93 90 64 112 109 106 76 158 81 77 54 75<br />
Source: Compiled by the UNCTAD secretariat, on the basis <strong>of</strong> information in Shipping Statistics and Market <strong>Review</strong>, vol. 53,<br />
no. 3, March <strong>2010</strong>: 61–62, published by the Institute <strong>of</strong> Shipping Economics and Logistics.


