

Review of Maritime Transport 2010 - Unctad
Review of Maritime Transport 2010 - Unctad
Review of Maritime Transport 2010 - Unctad

Create successful ePaper yourself
Turn your PDF publications into a flip-book with our unique Google optimized e-Paper software.
CHapteR 2: stRUCtURe, owneRsHip and RegistRation <strong>of</strong> tHe woRLd fLeet 57<br />
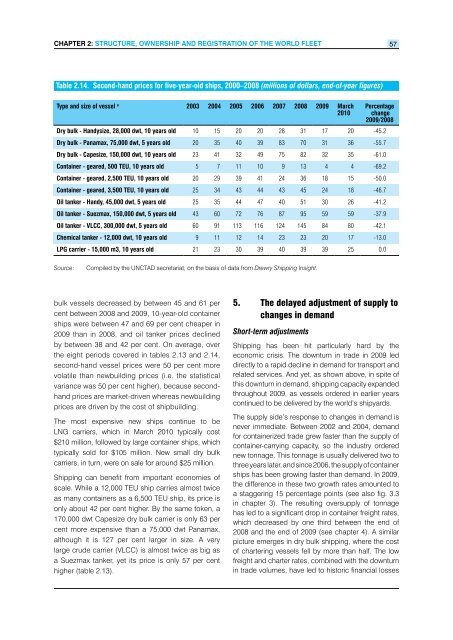
Table 2.14. Second-hand prices for five-year-old ships, 2000–2008 (millions <strong>of</strong> dollars, end-<strong>of</strong>-year figures)<br />
Type and size <strong>of</strong> vessel a 2003 2004 2005 2006 2007 2008 2009 March<br />
<strong>2010</strong><br />
Percentage<br />
change<br />
2009/2008<br />
Dry bulk - Handysize, 28,000 dwt, 10 years old 10 15 20 20 28 31 17 20 -45.2<br />
Dry bulk - Panamax, 75,000 dwt, 5 years old 20 35 40 39 83 70 31 36 -55.7<br />
Dry bulk - Capesize, 150,000 dwt, 10 years old 23 41 32 49 75 82 32 35 -61.0<br />
Container - geared, 500 TEU, 10 years old 5 7 11 10 9 13 4 4 -69.2<br />
Container - geared, 2,500 TEU, 10 years old 20 29 39 41 24 36 18 15 -50.0<br />
Container - geared, 3,500 TEU, 10 years old 25 34 43 44 43 45 24 18 -46.7<br />
Oil tanker - Handy, 45,000 dwt, 5 years old 25 35 44 47 40 51 30 26 -41.2<br />
Oil tanker - Suezmax, 150,000 dwt, 5 years old 43 60 72 76 87 95 59 59 -37.9<br />
Oil tanker - VLCC, 300,000 dwt, 5 years old 60 91 113 116 124 145 84 80 -42.1<br />
Chemical tanker - 12,000 dwt, 10 years old 9 11 12 14 23 23 20 17 -13.0<br />
LPG carrier - 15,000 m3, 10 years old 21 23 30 39 40 39 39 25 0.0<br />
Source: Compiled by the UNCTAD secretariat, on the basis <strong>of</strong> data from Drewry Shipping Insight.<br />
bulk vessels decreased by between 45 and 61 per<br />
cent between 2008 and 2009, 10-year-old container<br />
ships were between 47 and 69 per cent cheaper in<br />
2009 than in 2008, and oil tanker prices declined<br />
by between 38 and 42 per cent. On average, over<br />
the eight periods covered in tables 2.13 and 2.14,<br />
second-hand vessel prices were 50 per cent more<br />
volatile than newbuilding prices (i.e. the statistical<br />
variance was 50 per cent higher), because secondhand<br />
prices are market-driven whereas newbuilding<br />
prices are driven by the cost <strong>of</strong> shipbuilding.<br />
The most expensive new ships continue to be<br />
LNG carriers, which in March <strong>2010</strong> typically cost<br />
$210 million, followed by large container ships, which<br />
typically sold for $105 million. New small dry bulk<br />
carriers, in turn, were on sale for around $25 million.<br />
Shipping can benefit from important economies <strong>of</strong><br />
scale. While a 12,000 TEU ship carries almost twice<br />
as many containers as a 6,500 TEU ship, its price is<br />
only about 42 per cent higher. By the same token, a<br />
170,000 dwt Capesize dry bulk carrier is only 63 per<br />
cent more expensive than a 75,000 dwt Panamax,<br />
although it is 127 per cent larger in size. A very<br />
large crude carrier (VLCC) is almost twice as big as<br />
a Suezmax tanker, yet its price is only 57 per cent<br />
higher (table 2.13).<br />
5. the delayed adjustment <strong>of</strong> supply to<br />
changes in demand<br />
Short-term adjustments<br />
Shipping has been hit particularly hard by the<br />
economic crisis. The downturn in trade in 2009 led<br />
directly to a rapid decline in demand for transport and<br />
related services. And yet, as shown above, in spite <strong>of</strong><br />
this downturn in demand, shipping capacity expanded<br />
throughout 2009, as vessels ordered in earlier years<br />
continued to be delivered by the world’s shipyards.<br />
The supply side’s response to changes in demand is<br />
never immediate. Between 2002 and 2004, demand<br />
for containerized trade grew faster than the supply <strong>of</strong><br />
container-carrying capacity, so the industry ordered<br />
new tonnage. This tonnage is usually delivered two to<br />
three years later, and since 2006, the supply <strong>of</strong> container<br />
ships has been growing faster than demand. In 2009,<br />
the difference in these two growth rates amounted to<br />
a staggering 15 percentage points (see also fig. 3.3<br />
in chapter 3). The resulting oversupply <strong>of</strong> tonnage<br />
has led to a significant drop in container freight rates,<br />
which decreased by one third between the end <strong>of</strong><br />
2008 and the end <strong>of</strong> 2009 (see chapter 4). A similar<br />
picture emerges in dry bulk shipping, where the cost<br />
<strong>of</strong> chartering vessels fell by more than half. The low<br />
freight and charter rates, combined with the downturn<br />
in trade volumes, have led to historic financial losses


