

Review of Maritime Transport 2010 - Unctad
Review of Maritime Transport 2010 - Unctad
Review of Maritime Transport 2010 - Unctad

You also want an ePaper? Increase the reach of your titles
YUMPU automatically turns print PDFs into web optimized ePapers that Google loves.
146<br />
<strong>Review</strong> <strong>of</strong> MaRitiMe tRanspoRt <strong>2010</strong><br />
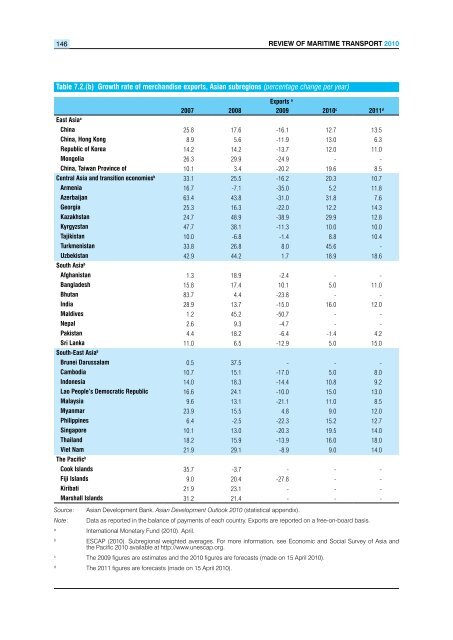
Table 7.2.(b) Growth rate <strong>of</strong> merchandise exports, Asian subregions (percentage change per year)<br />
East Asia a<br />
Exports a<br />
2007 2008 2009 <strong>2010</strong> c 2011 d<br />
China 25.8 17.6 -16.1 12.7 13.5<br />
China, Hong Kong 8.9 5.6 -11.9 13.0 6.3<br />
Republic <strong>of</strong> Korea 14.2 14.2 -13.7 12.0 11.0<br />
Mongolia 26.3 29.9 -24.9 - -<br />
China, Taiwan Province <strong>of</strong> 10.1 3.4 -20.2 19.6 8.5<br />
Central Asia and transition economiesb 33.1 25.5 -16.2 20.3 10.7<br />
Armenia 16.7 -7.1 -35.0 5.2 11.8<br />
Azerbaijan 63.4 43.8 -31.0 31.8 7.6<br />
Georgia 25.3 16.3 -22.0 12.2 14.3<br />
Kazakhstan 24.7 48.9 -38.9 29.9 12.8<br />
Kyrgyzstan 47.7 38.1 -11.3 10.0 10.0<br />
Tajikistan 10.0 -6.8 -1.4 8.8 10.4<br />
Turkmenistan 33.8 26.8 8.0 45.6 -<br />
Uzbekistan 42.9 44.2 1.7 18.9 18.6<br />
South Asia b<br />
Afghanistan 1.3 18.9 -2.4 - -<br />
Bangladesh 15.8 17.4 10.1 5.0 11.0<br />
Bhutan 83.7 4.4 -23.8 - -<br />
India 28.9 13.7 -15.0 16.0 12.0<br />
Maldives 1.2 45.2 -50.7 - -<br />
Nepal 2.6 9.3 -4.7 - -<br />
Pakistan 4.4 18.2 -6.4 -1.4 4.2<br />
Sri Lanka 11.0 6.5 -12.9 5.0 15.0<br />
South-East Asia b<br />
Brunei Darussalam 0.5 37.5 - - -<br />
Cambodia 10.7 15.1 -17.0 5.0 8.0<br />
Indonesia 14.0 18.3 -14.4 10.8 9.2<br />
Lao People’s Democratic Republic 16.6 24.1 -10.0 15.0 13.0<br />
Malaysia 9.6 13.1 -21.1 11.0 8.5<br />
Myanmar 23.9 15.5 4.8 9.0 12.0<br />
Philippines 6.4 -2.5 -22.3 15.2 12.7<br />
Singapore 10.1 13.0 -20.3 19.5 14.0<br />
Thailand 18.2 15.9 -13.9 16.0 18.0<br />
Viet Nam 21.9 29.1 -8.9 9.0 14.0<br />
The Pacific b<br />
Cook Islands 35.7 -3.7 - - -<br />
Fiji Islands 9.0 20.4 -27.8 - -<br />
Kiribati 21.9 23.1 - - -<br />
Marshall Islands 31.2 21.4 - - -<br />
Source: Asian Development Bank. Asian Development Outlook <strong>2010</strong> (statistical appendix).<br />
Note: Data as reported in the balance <strong>of</strong> payments <strong>of</strong> each country. Exports are reported on a free-on-board basis.<br />
a International Monetary Fund (<strong>2010</strong>). April.<br />
b ESCAP (<strong>2010</strong>). Subregional weighted averages. For more information, see Economic and Social Survey <strong>of</strong> Asia and<br />
the Pacific <strong>2010</strong> available at http://www.unescap.org.<br />
c The 2009 figures are estimates and the <strong>2010</strong> figures are forecasts (made on 15 April <strong>2010</strong>).<br />
d The 2011 figures are forecasts (made on 15 April <strong>2010</strong>).


