

Review of Maritime Transport 2010 - Unctad
Review of Maritime Transport 2010 - Unctad
Review of Maritime Transport 2010 - Unctad

You also want an ePaper? Increase the reach of your titles
YUMPU automatically turns print PDFs into web optimized ePapers that Google loves.
34<br />
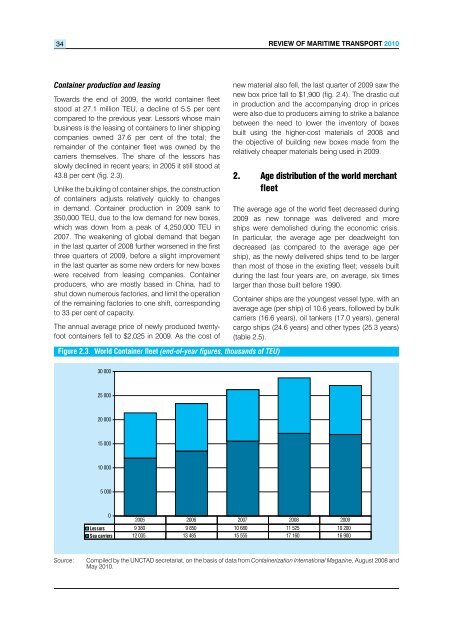
Container production and leasing<br />
Towards the end <strong>of</strong> 2009, the world container fleet<br />
stood at 27.1 million TEU, a decline <strong>of</strong> 5.5 per cent<br />
compared to the previous year. Lessors whose main<br />
business is the leasing <strong>of</strong> containers to liner shipping<br />
companies owned 37.6 per cent <strong>of</strong> the total; the<br />
remainder <strong>of</strong> the container fleet was owned by the<br />
carriers themselves. The share <strong>of</strong> the lessors has<br />
slowly declined in recent years; in 2005 it still stood at<br />
43.8 per cent (fig. 2.3).<br />
Unlike the building <strong>of</strong> container ships, the construction<br />
<strong>of</strong> containers adjusts relatively quickly to changes<br />
in demand. Container production in 2009 sank to<br />
350,000 TEU, due to the low demand for new boxes,<br />
which was down from a peak <strong>of</strong> 4,250,000 TEU in<br />
2007. The weakening <strong>of</strong> global demand that began<br />
in the last quarter <strong>of</strong> 2008 further worsened in the first<br />
three quarters <strong>of</strong> 2009, before a slight improvement<br />
in the last quarter as some new orders for new boxes<br />
were received from leasing companies. Container<br />
producers, who are mostly based in China, had to<br />
shut down numerous factories, and limit the operation<br />
<strong>of</strong> the remaining factories to one shift, corresponding<br />
to 33 per cent <strong>of</strong> capacity.<br />
The annual average price <strong>of</strong> newly produced twentyfoot<br />
containers fell to $2,025 in 2009. As the cost <strong>of</strong><br />
Figure 2.3. World Container fleet (end-<strong>of</strong>-year figures, thousands <strong>of</strong> TEU)<br />
30 000<br />
25 000<br />
20 000<br />
15 000<br />
10 000<br />
5 000<br />
0<br />
<strong>Review</strong> <strong>of</strong> MaRitiMe tRanspoRt <strong>2010</strong><br />
new material also fell, the last quarter <strong>of</strong> 2009 saw the<br />
new box price fall to $1,900 (fig. 2.4). The drastic cut<br />
in production and the accompanying drop in prices<br />
were also due to producers aiming to strike a balance<br />
between the need to lower the inventory <strong>of</strong> boxes<br />
built using the higher-cost materials <strong>of</strong> 2008 and<br />
the objective <strong>of</strong> building new boxes made from the<br />
relatively cheaper materials being used in 2009.<br />
2. age distribution <strong>of</strong> the world merchant<br />
fleet<br />
The average age <strong>of</strong> the world fleet decreased during<br />
2009 as new tonnage was delivered and more<br />
ships were demolished during the economic crisis.<br />
In particular, the average age per deadweight ton<br />
decreased (as compared to the average age per<br />
ship), as the newly delivered ships tend to be larger<br />
than most <strong>of</strong> those in the existing fleet; vessels built<br />
during the last four years are, on average, six times<br />
larger than those built before 1990.<br />
Container ships are the youngest vessel type, with an<br />
average age (per ship) <strong>of</strong> 10.6 years, followed by bulk<br />
carriers (16.6 years), oil tankers (17.0 years), general<br />
cargo ships (24.6 years) and other types (25.3 years)<br />
(table 2.5).<br />
2005 2006 2007 2008 2009<br />
Lessors 9 380 9 850 10 680 11 525 10 200<br />
Sea carriers 12 035 13 485 15 555 17 160 16 900<br />
Source: Compiled by the UNCTAD secretariat, on the basis <strong>of</strong> data from Containerization International Magazine, August 2008 and<br />
May <strong>2010</strong>.


