

Review of Maritime Transport 2010 - Unctad
Review of Maritime Transport 2010 - Unctad
Review of Maritime Transport 2010 - Unctad

You also want an ePaper? Increase the reach of your titles
YUMPU automatically turns print PDFs into web optimized ePapers that Google loves.
96<br />
<strong>Review</strong> <strong>of</strong> MaRitiMe tRanspoRt <strong>2010</strong><br />
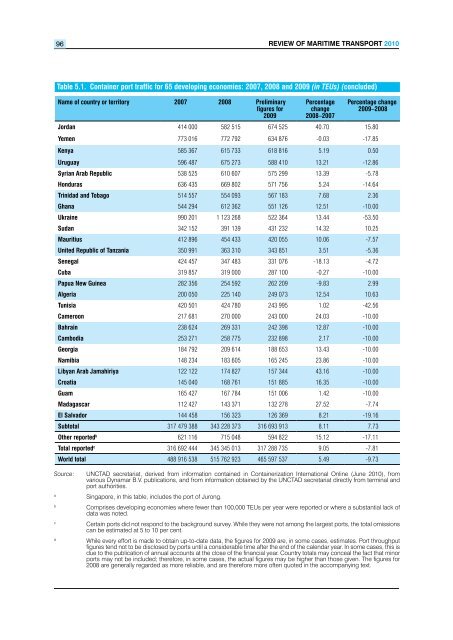
Table 5.1. Container port traffic for 65 developing economies: 2007, 2008 and 2009 (in TEUs) (concluded)<br />
Name <strong>of</strong> country or territory 2007 2008 Preliminary<br />
figures for<br />
2009<br />
Percentage<br />
change<br />
2008–2007<br />
Percentage change<br />
2009–2008<br />
Jordan 414 000 582 515 674 525 40.70 15.80<br />
Yemen 773 016 772 792 634 876 -0.03 -17.85<br />
Kenya 585 367 615 733 618 816 5.19 0.50<br />
Uruguay 596 487 675 273 588 410 13.21 -12.86<br />
Syrian Arab Republic 538 525 610 607 575 299 13.39 -5.78<br />
Honduras 636 435 669 802 571 756 5.24 -14.64<br />
Trinidad and Tobago 514 557 554 093 567 183 7.68 2.36<br />
Ghana 544 294 612 362 551 126 12.51 -10.00<br />
Ukraine 990 201 1 123 268 522 364 13.44 -53.50<br />
Sudan 342 152 391 139 431 232 14.32 10.25<br />
Mauritius 412 896 454 433 420 055 10.06 -7.57<br />
United Republic <strong>of</strong> Tanzania 350 991 363 310 343 851 3.51 -5.36<br />
Senegal 424 457 347 483 331 076 -18.13 -4.72<br />
Cuba 319 857 319 000 287 100 -0.27 -10.00<br />
Papua New Guinea 282 356 254 592 262 209 -9.83 2.99<br />
Algeria 200 050 225 140 249 073 12.54 10.63<br />
Tunisia 420 501 424 780 243 995 1.02 -42.56<br />
Cameroon 217 681 270 000 243 000 24.03 -10.00<br />
Bahrain 238 624 269 331 242 398 12.87 -10.00<br />
Cambodia 253 271 258 775 232 898 2.17 -10.00<br />
Georgia 184 792 209 614 188 653 13.43 -10.00<br />
Namibia 148 234 183 605 165 245 23.86 -10.00<br />
Libyan Arab Jamahiriya 122 122 174 827 157 344 43.16 -10.00<br />
Croatia 145 040 168 761 151 885 16.35 -10.00<br />
Guam 165 427 167 784 151 006 1.42 -10.00<br />
Madagascar 112 427 143 371 132 278 27.52 -7.74<br />
El Salvador 144 458 156 323 126 369 8.21 -19.16<br />
Subtotal 317 479 388 343 228 373 316 693 913 8.11 7.73<br />
Other reported b 621 116 715 048 594 822 15.12 -17.11<br />
Total reported c 316 692 444 345 345 013 317 288 735 9.05 -7.81<br />
World total 488 916 538 515 762 923 465 597 537 5.49 -9.73<br />
Source: UNCTAD secretariat, derived from information contained in Containerization International Online (June <strong>2010</strong>), from<br />
various Dynamar B.V. publications, and from information obtained by the UNCTAD secretariat directly from terminal and<br />
port authorities.<br />
a Singapore, in this table, includes the port <strong>of</strong> Jurong.<br />
b Comprises developing economies where fewer than 100,000 TEUs per year were reported or where a substantial lack <strong>of</strong><br />
data was noted.<br />
c Certain ports did not respond to the background survey. While they were not among the largest ports, the total omissions<br />
can be estimated at 5 to 10 per cent.<br />
d While every effort is made to obtain up-to-date data, the figures for 2009 are, in some cases, estimates. Port throughput<br />
figures tend not to be disclosed by ports until a considerable time after the end <strong>of</strong> the calendar year. In some cases, this is<br />
due to the publication <strong>of</strong> annual accounts at the close <strong>of</strong> the financial year. Country totals may conceal the fact that minor<br />
ports may not be included; therefore, in some cases, the actual figures may be higher than those given. The figures for<br />
2008 are generally regarded as more reliable, and are therefore more <strong>of</strong>ten quoted in the accompanying text.


